Loop Clusters Dialog Box
In this dialog box you can examine the loop clusters for each of the CDR regions in an antibody prediction, filtered by sequence similarity, and select a cluster for the chosen loop (which is reported in the title bar).
To open this dialog box, select a row in the input selection table of the Basic Loop Model step and click Details.
- Using
- Features
- Additional Resources
Using the Loop Clusters Dialog Box
To filter the cluster table to show only the most similar clusters, set the minimum similarity value in the Minimum similarity box. Any cluster that has a loop whose sequence similarity to the query loop is greater than this cutoff is shown in the table. You can also sort the table by clicking on a column heading.
To return to the default loop cluster selection, click Reset Selection.
The initial selection is done by locating the first cluster in the sorted list that has a member whose loop similarity to that of the query is greater than the specified cutoff. The cluster member with the greatest similarity to the query is the one that is used by default to build the loop.
Loop Clusters Dialog Box Features
- Minimum similarity box
-
Set the minimum similarity between a loop from the database and the query loop. Only the clusters that contain at least one loop whose similarity to the query is greater than this threshold are used in building the model. These clusters are the ones that are shown in the table, and their number is indicated by "n CDR loops" beneath.
- Loop cluster table
-
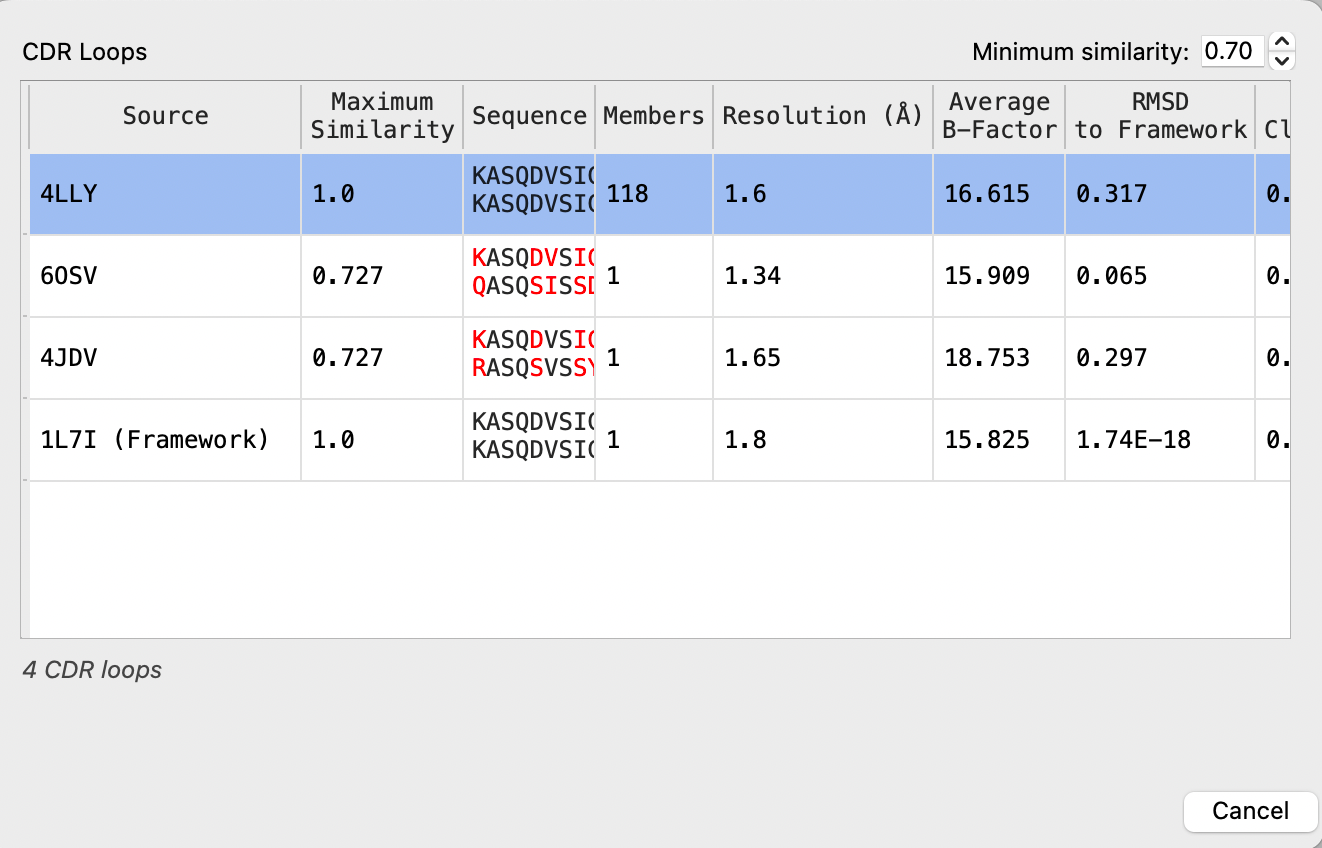
List of loop clusters that are of the same length as the query loop. The clusters are filtered by minimum similarity to the query. The most similar structure in each cluster is the one listed, as the cluster representative. You can select a single row in the table to use the cluster representative as the template for the chosen loop. You can sort the table by clicking on a column heading. The table columns are:
Source PDB ID of the cluster representative. The template used for the framework region is also included in the list. Max Similarity Maximum sequence similarity of the specified loop in any cluster member to that of the query. This is the similarity of the cluster representative. Sequence Sequence of the query for this loop (above) and of the cluster representative (below). Residues that differ are marked in red. Members Number of members of the cluster. Resolution Resolution of the X-ray structure for the cluster representative, in angstroms. Average B-Factor Temperature factor of the X-ray structure for the cluster representative, averaged over the backbone atoms of the loop. RMSD to Framework RMS deviation of the coordinate sof the CDR loop stem residues in the cluster representative from those of the framework template. RMSD within Cluster (Average) Average of the RMS deviations of the coordinates of each pair of loops in the cluster. RMSD within Cluster (Maximum) Maximum RMS deviation of the coordinates of any pair of loops in the cluster.