Plotting Spectra
The Spectrum Plot Panel in Maestro can be used to plot UV/visible, IR/Raman, VCD and ECD spectra. The spectral data are stored in spectrum (.spm) files, which are written when you run the relevant calculation:TDDFT (or CIS) for UV/visible spectra (_uvv.spm), frequencies for IR spectra (_vib.spm) and Raman intensities for Raman spectra (_raman_vib.spm), and vibrational or electronic circular dichroism for VCD or ECD spectra (_vcd.spm, _ecd.spm).
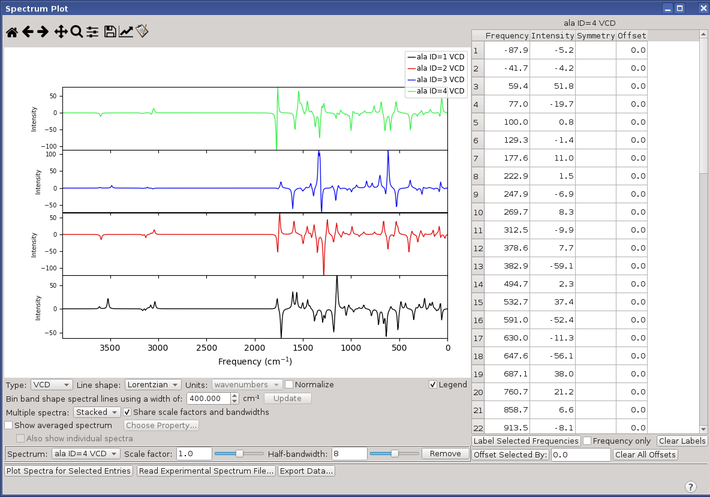
The panel allows you to plot single spectra or multiple spectra. Multiple spectra can be displayed in an overlaid format, in a stacked format, or as a weighted average. Spectra are plotted for the entries that are selected in the Project Table, so you should first select the relevant entries. To open the panel: click the Tasks button and browse to Quantum Mechanics → Plot Spectra.
When the panel opens, the first task is to choose the spectrum type from the Type option menu. You must do this before importing the spectrum files, so that the file selector lists files of the correct type. You can make other settings before importing the spectra, such as the line shape and units, and whether to display the legend. If you have multiple spectra, you can choose how they are displayed from the Multiple spectra option menu.
To create the spectra, click Plot Spectra for Selected Entries. The spectrum files are read and the spectra are displayed. If any of the files is missing, a file selector opens, so that you can select the correct spectrum file. The file selector title includes the entry title and entry ID.
Colors and line styles are assigned automatically, but you can change them if you want. To do this, choose the particular spectrum from the Spectrum option menu, then click the Edit axes and curve settings toolbar button, and use the Figure Options dialog box to make settings for the title, range, labeling, and scale of the axes; the color, style, and width of lines; and the color, style, and size of markers.

You can also change the scaling factor for the transition energies or frequencies and the width of the lines. If Share scale factors and bandwidths is selected, the spectra all have the same scaling factor and widths. Deselect this option to if you want to make different settings values for one or more spectra.
The list of spectral lines is given in the table on the right. If you want to label certain peaks in the spectrum with the frequency and intensity, you can select the lines in the table and click Label Selected Frequencies. To remove the labels, click Clear Labels. To label them with only the frequency (and not the intensity), select Frequency only.
You can adjust the positions of individual lines in the spectrum. To do this, edit the value in the Offset column, which is zero by default. The spectrum is recalculated when you have edited a value. If you want to apply the same offset to several lines, select them in the table, and enter a value in the text box next to the Offset Selected By button, and click the button. The offsets are added to the table, and the spectrum is recalculated.
You can remove a spectrum from the display by selecting it from the Spectrum option menu and clicking Remove. If you remove a spectrum, it cannot be restored. You would then have to click Plot Spectra for Selected Entries again to redraw the spectra.
If you change the spectrum type on the Type option menu between UV/Vis or ECD and either VCD or IR/Raman, the current spectra are cleared, and you need to click Plot Spectra for Selected Entries to import the spectrum files for the new spectrum type. VCD, IR, and Raman spectra can be displayed at the same time.
To create an averaged spectrum, select Show averaged spectrum, then click Choose Property. A property selector opens, in which you can select an entry property. Suitable properties might be the concentration of the structures in solution, or Boltzmann weights calculated from the relative energies (which you can calculate click the Tasks button and browse to Structure Analysis → Calculate Boltzmann Populations). The property name is displayed to the right of the button. This is particularly useful for comparing with experimental VCD or ECD spectra, which are usually a conformational average. If you use the Jaguar Spectroscopy Panel to generate the spectra, averaged spectra are created automatically.
If you want to show the individual spectra as well as the averaged spectrum, select Also show individual spectra. The spectra are displayed either stacked or overlaid, depending on the choice made from the Multiple spectra option menu.
In addition to displaying predicted spectra, you can also read in experimental spectra by clicking Read Experimental Spectrum File. An experimental spectrum must be in a plain text file (.txt), consisting of pairs of frequency and intensity values, one per line, with the values separated by spaces. This allows you to compare experimental spectra with predicted spectra. The experimental spectra are always displayed, and are not included in any averaging. Experimental spectra have no data on the positions or intensities of lines, so the Frequency table is empty, and controls for the line shape or scaling factor are not available.
If you want to compare spectra in another program, you can export the spectral data (with the line broadening) to a text file. The file contains two columns for each spectrum, with the x (frequency) and y (intensity) data, labeled with the spectrum name as name-X and name-Y. To export the data, click Export Data, navigate to the location in the file selector, and name the file.