Results of a Macro-pKa calculation
You can view a summary of the Macro-pKa calculation results by opening the file <jobname>_final_results_figure/<jobname>_populations.html from the Output directory. You can also use the Workflow Action Menu  from the Maestro Entry List to open this file.
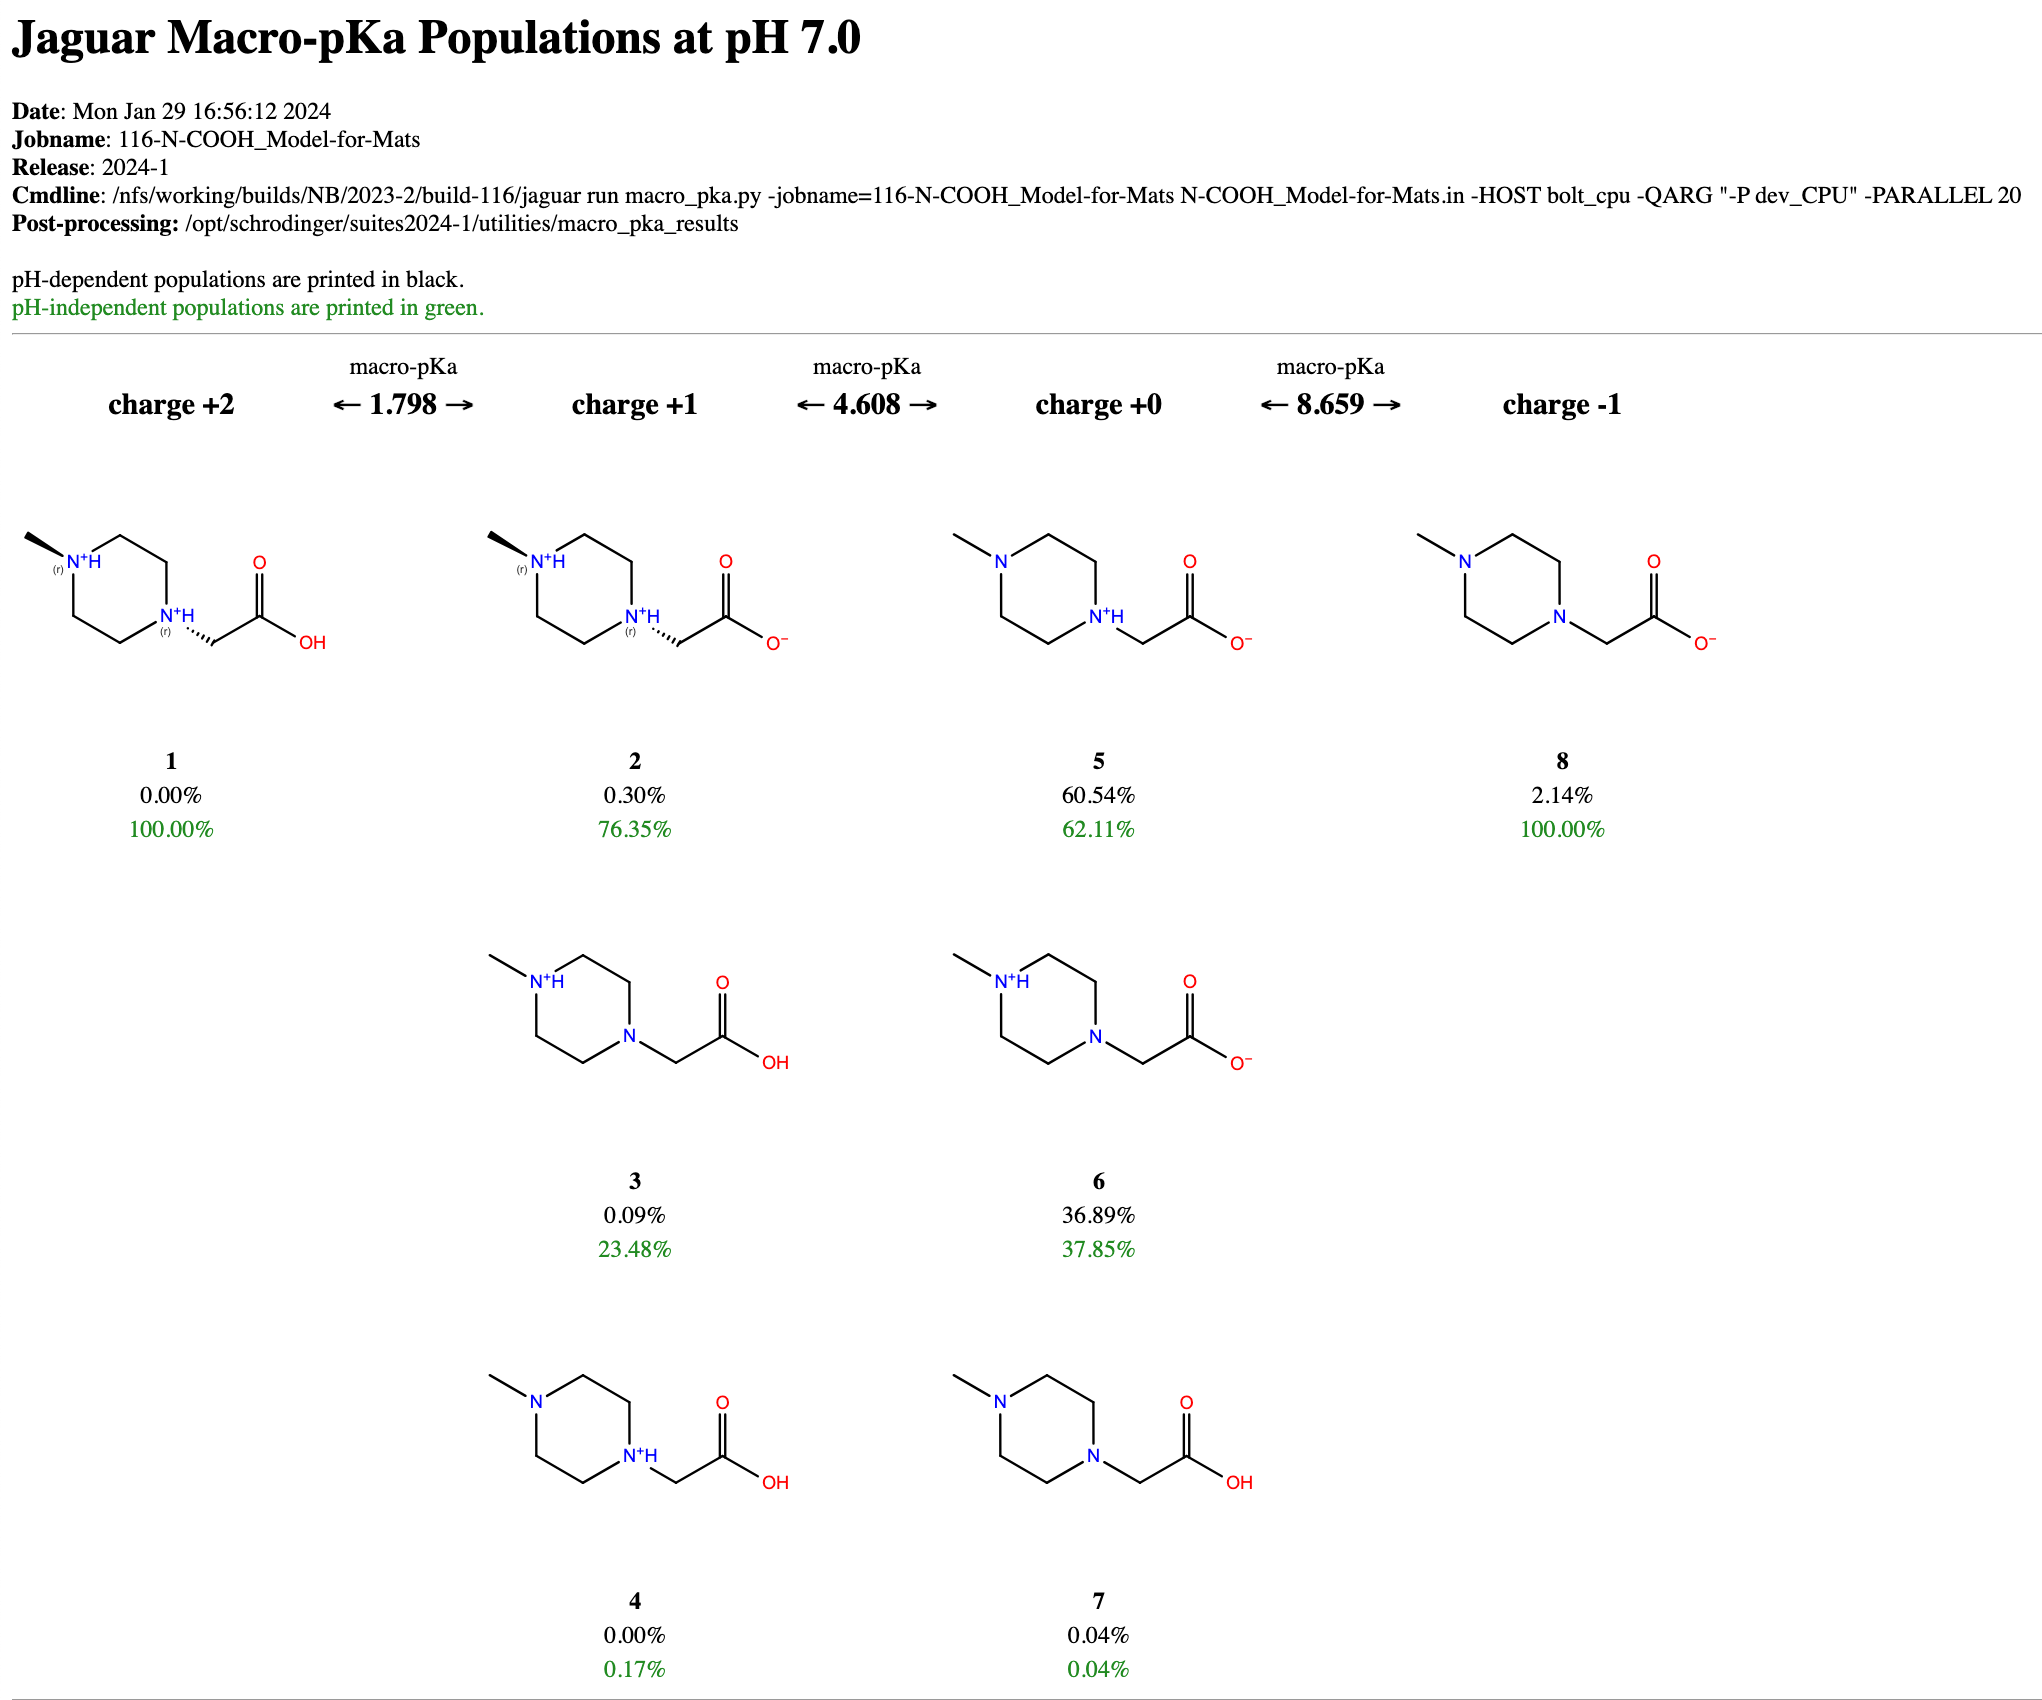
A 2D summary diagram shows the 2D Structures of the generated tautomers present at each charge, as well as their pH-dependent and pH-independent populations. The pH-dependent populations are based on the pH listed in the title.
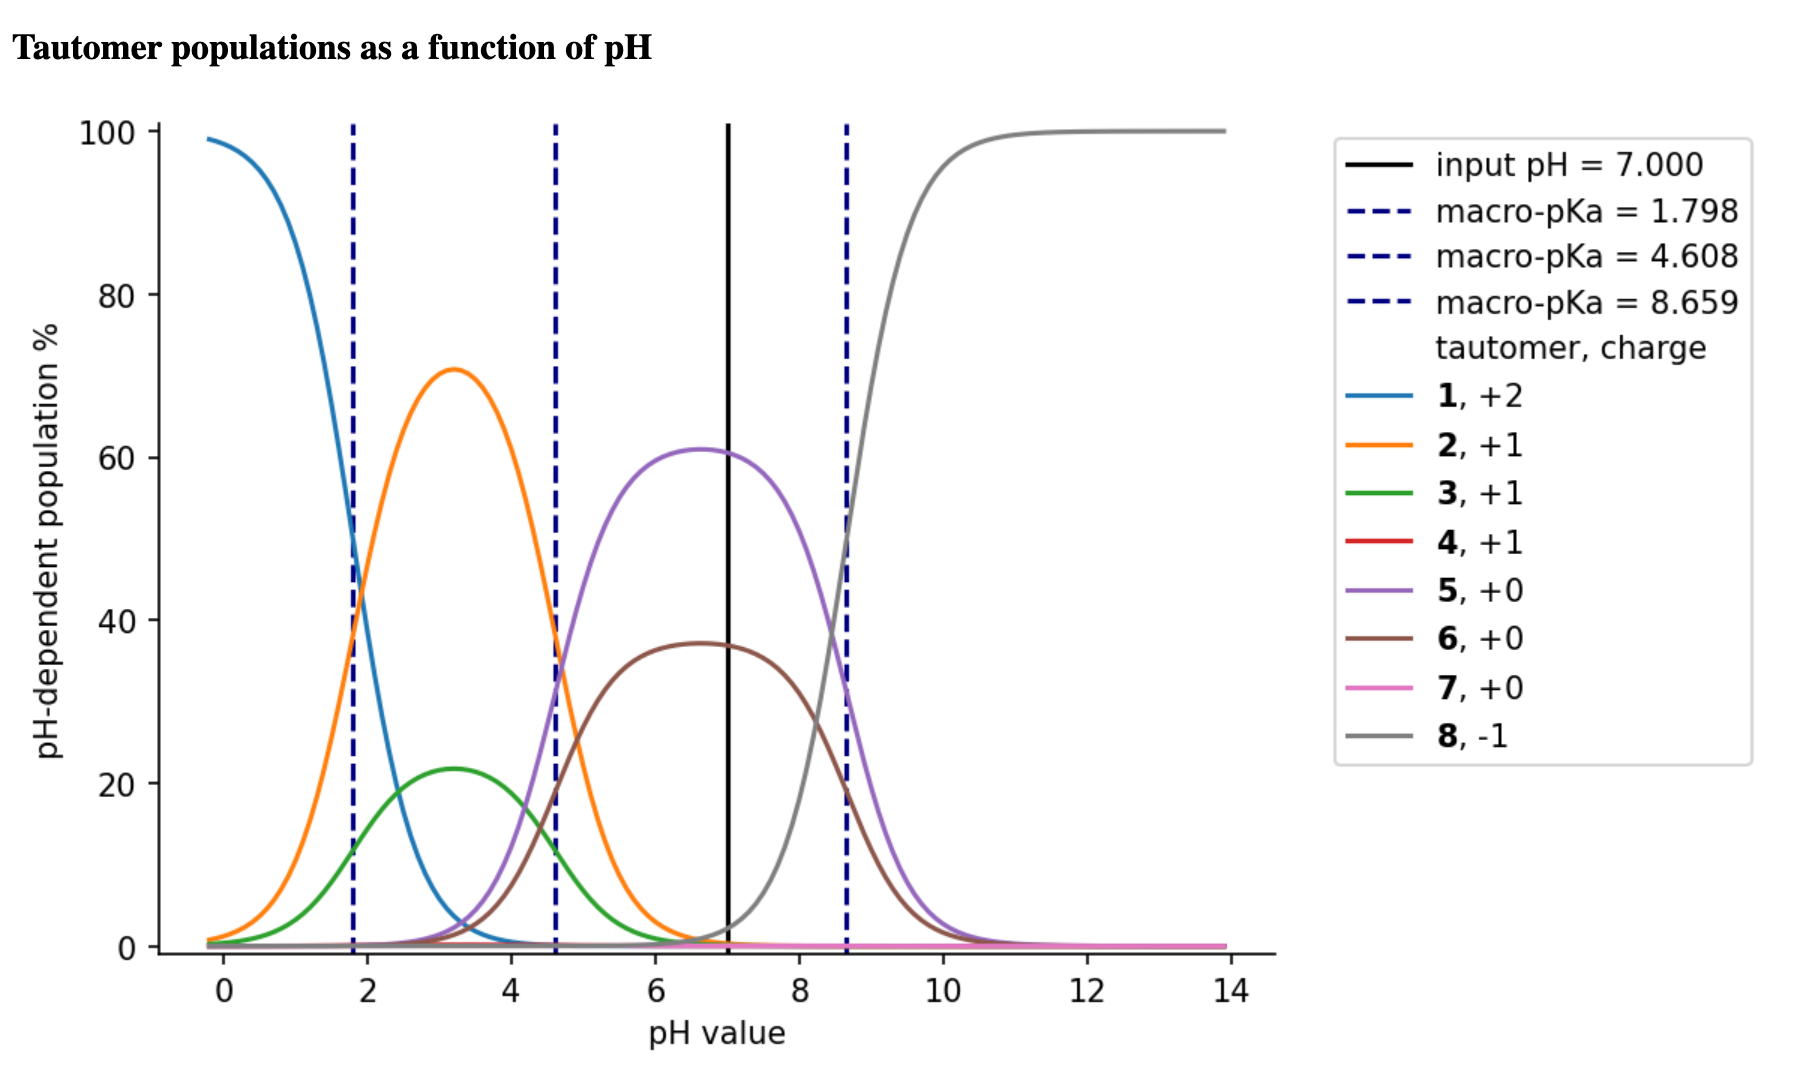
The graph below the 2D summary diagram plots how the tautomer population changes with pH.
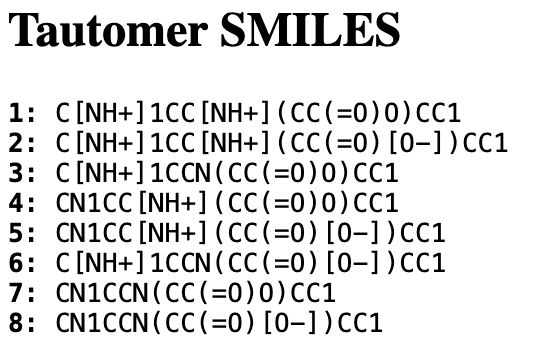
At the bottom of the page, a list of SMILES strings is given for each tautomer shown in the 2D summary diagram. The ID numbers are the same as the numbers in the plot legend.
You can use a post-processing script to display the summary page at a different pH. See The macro_pka_results Script.
See Macro-pKa Output Files and Directories for a breakdown of other helpful output files.