Breakdown of Empirical Corrections
Note
The following only applies if you use the Jaccard similarity method for empirical corrections.
As discussed in Applying Empirical Corrections for pKa Calculations, an empirical correction is applied to the raw pKa calculated for each tautomer:

|
(1) |
For a summary of how empirical corrections are computed for each micro-pKa calculation, open the empirical_corrections.html file from <jobname>_empirical_corrections/ directory.pka_<n>
f1 and f2 in the summary page correspond to the parameters a and b, respectively, in Equation 1.
A 2D diagram shows the 2D structures of the protonated and deprotonated states of the tautomer. The fragment used in similarity matching is highlighted.
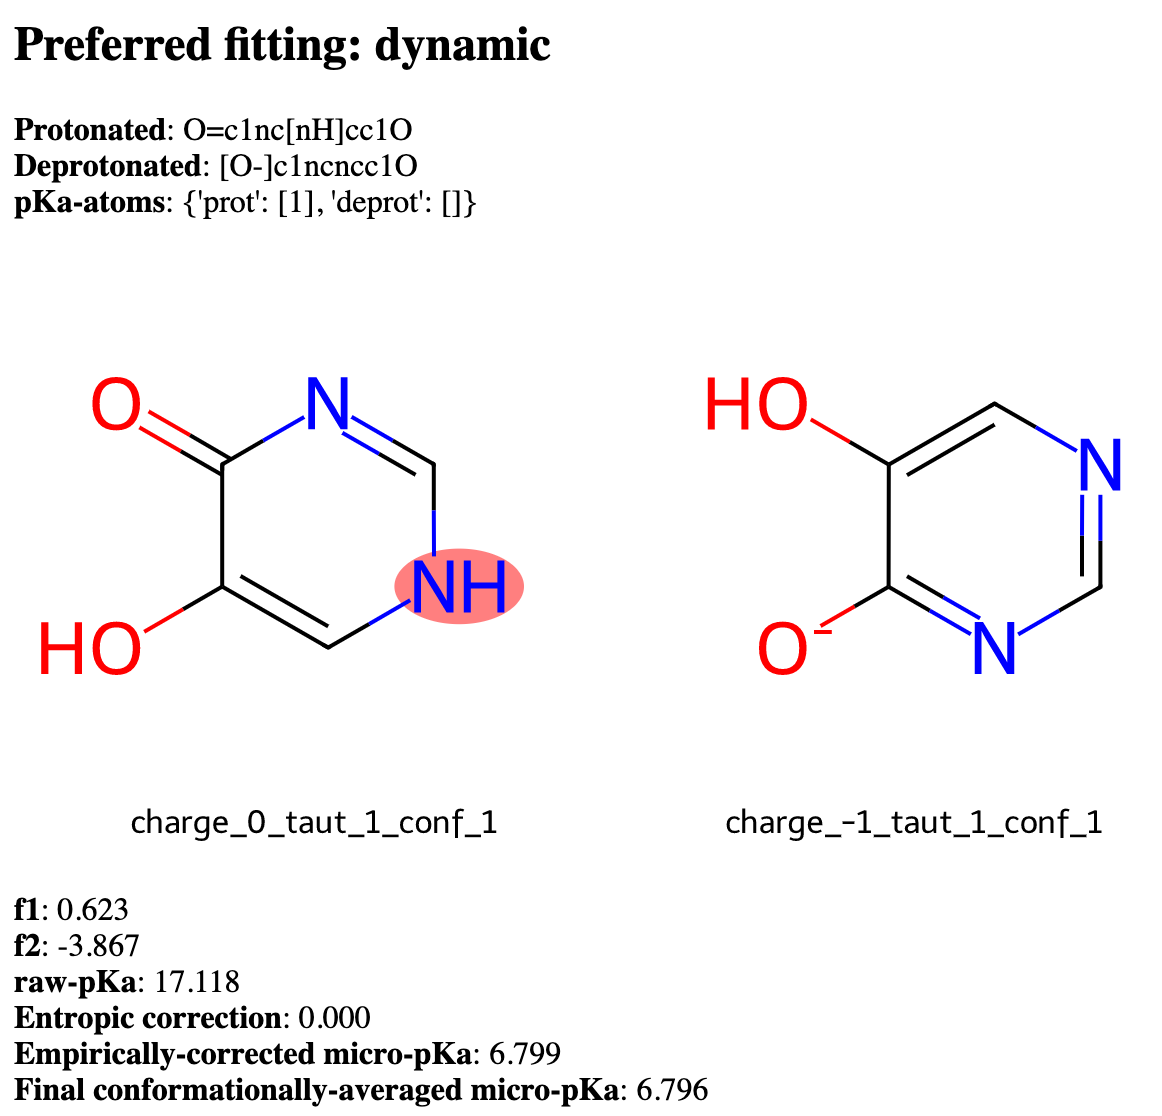
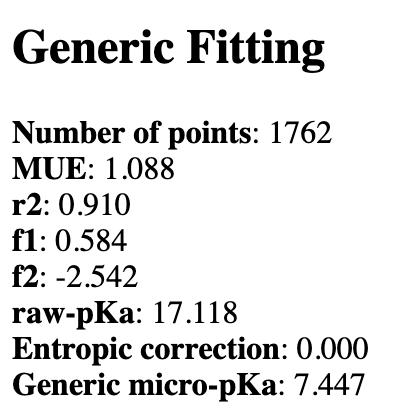
Information about the micro-pKa corrected using a fixed correction scheme is given, including the mean unsigned error (MUE), r2(r2), fitting parameter a(f1), fitting parameter b(f2), and the final corrected micro-pKa using the scheme.
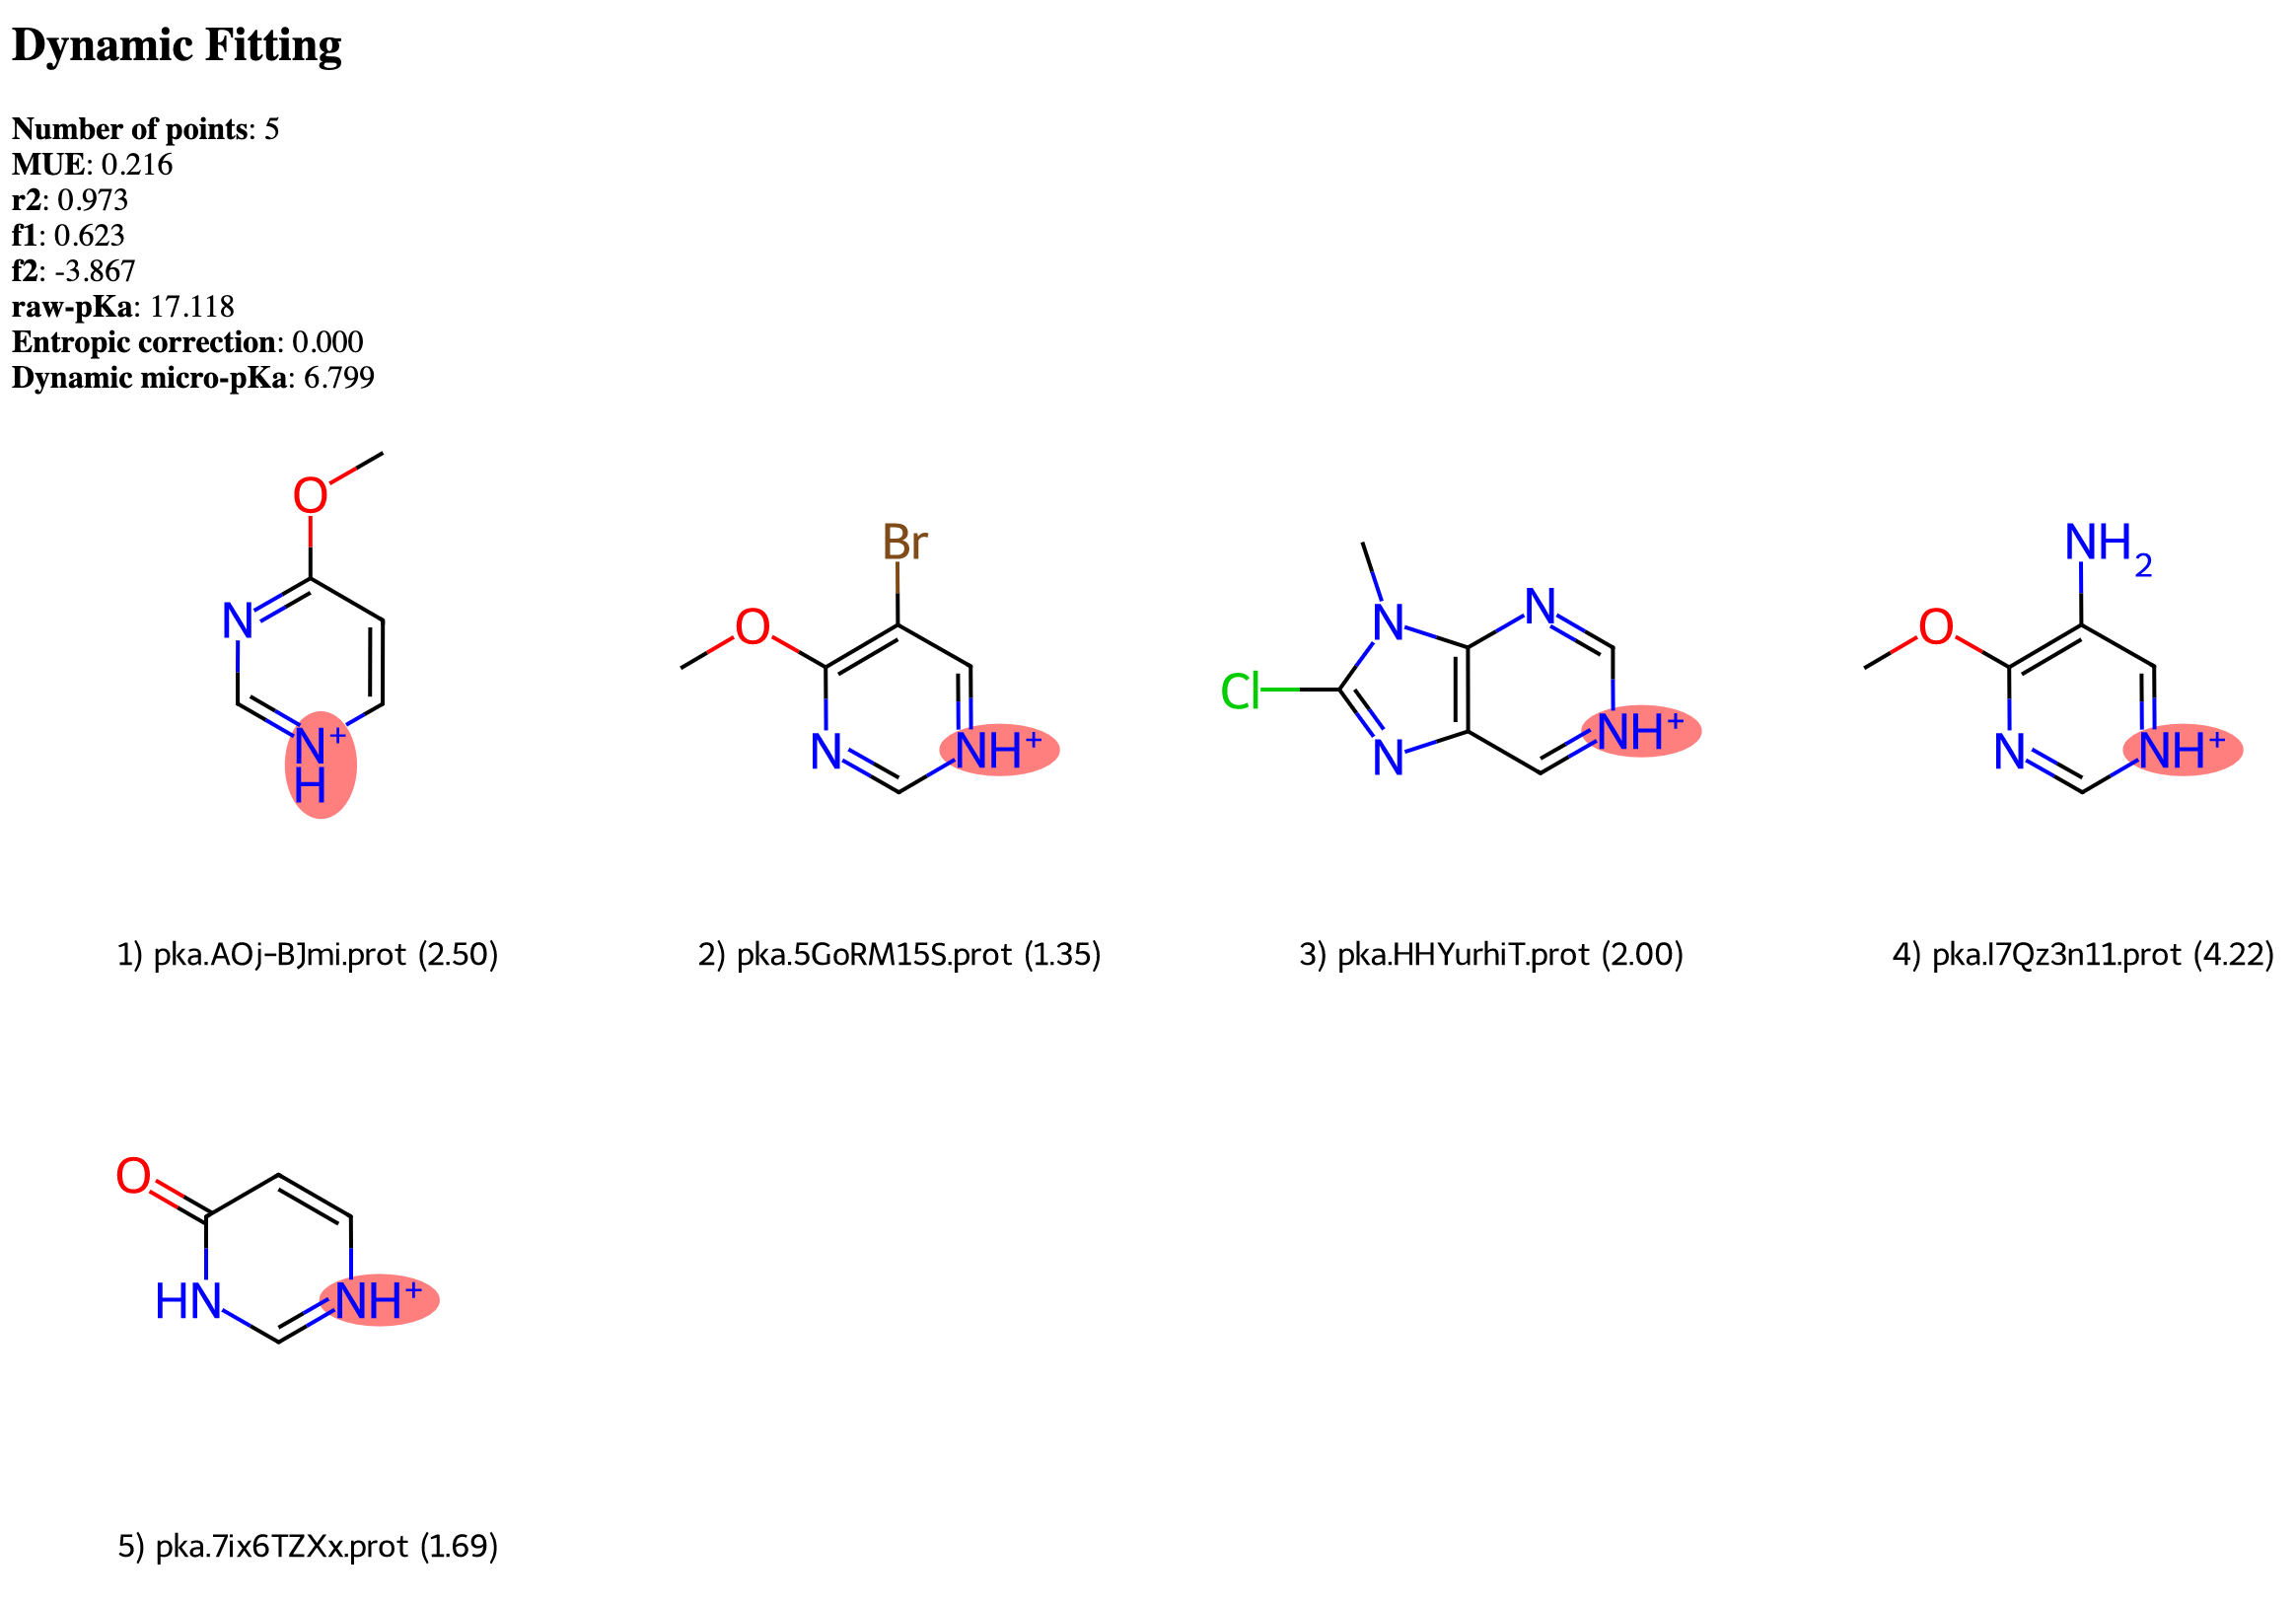
Information about the micro-pKa corrected using a the Jaccard similarity method (Dynamic Fitting) is given, including the number of reference data points used in the procedure, mean unsigned error (MUE), r2(r2), fitting parameter a(f1), fitting parameter b(f2), and the final corrected micro-pKa using the scheme. The 2D structures of the reference molecules used in the fit is shown, and the matching fragments highlighted.
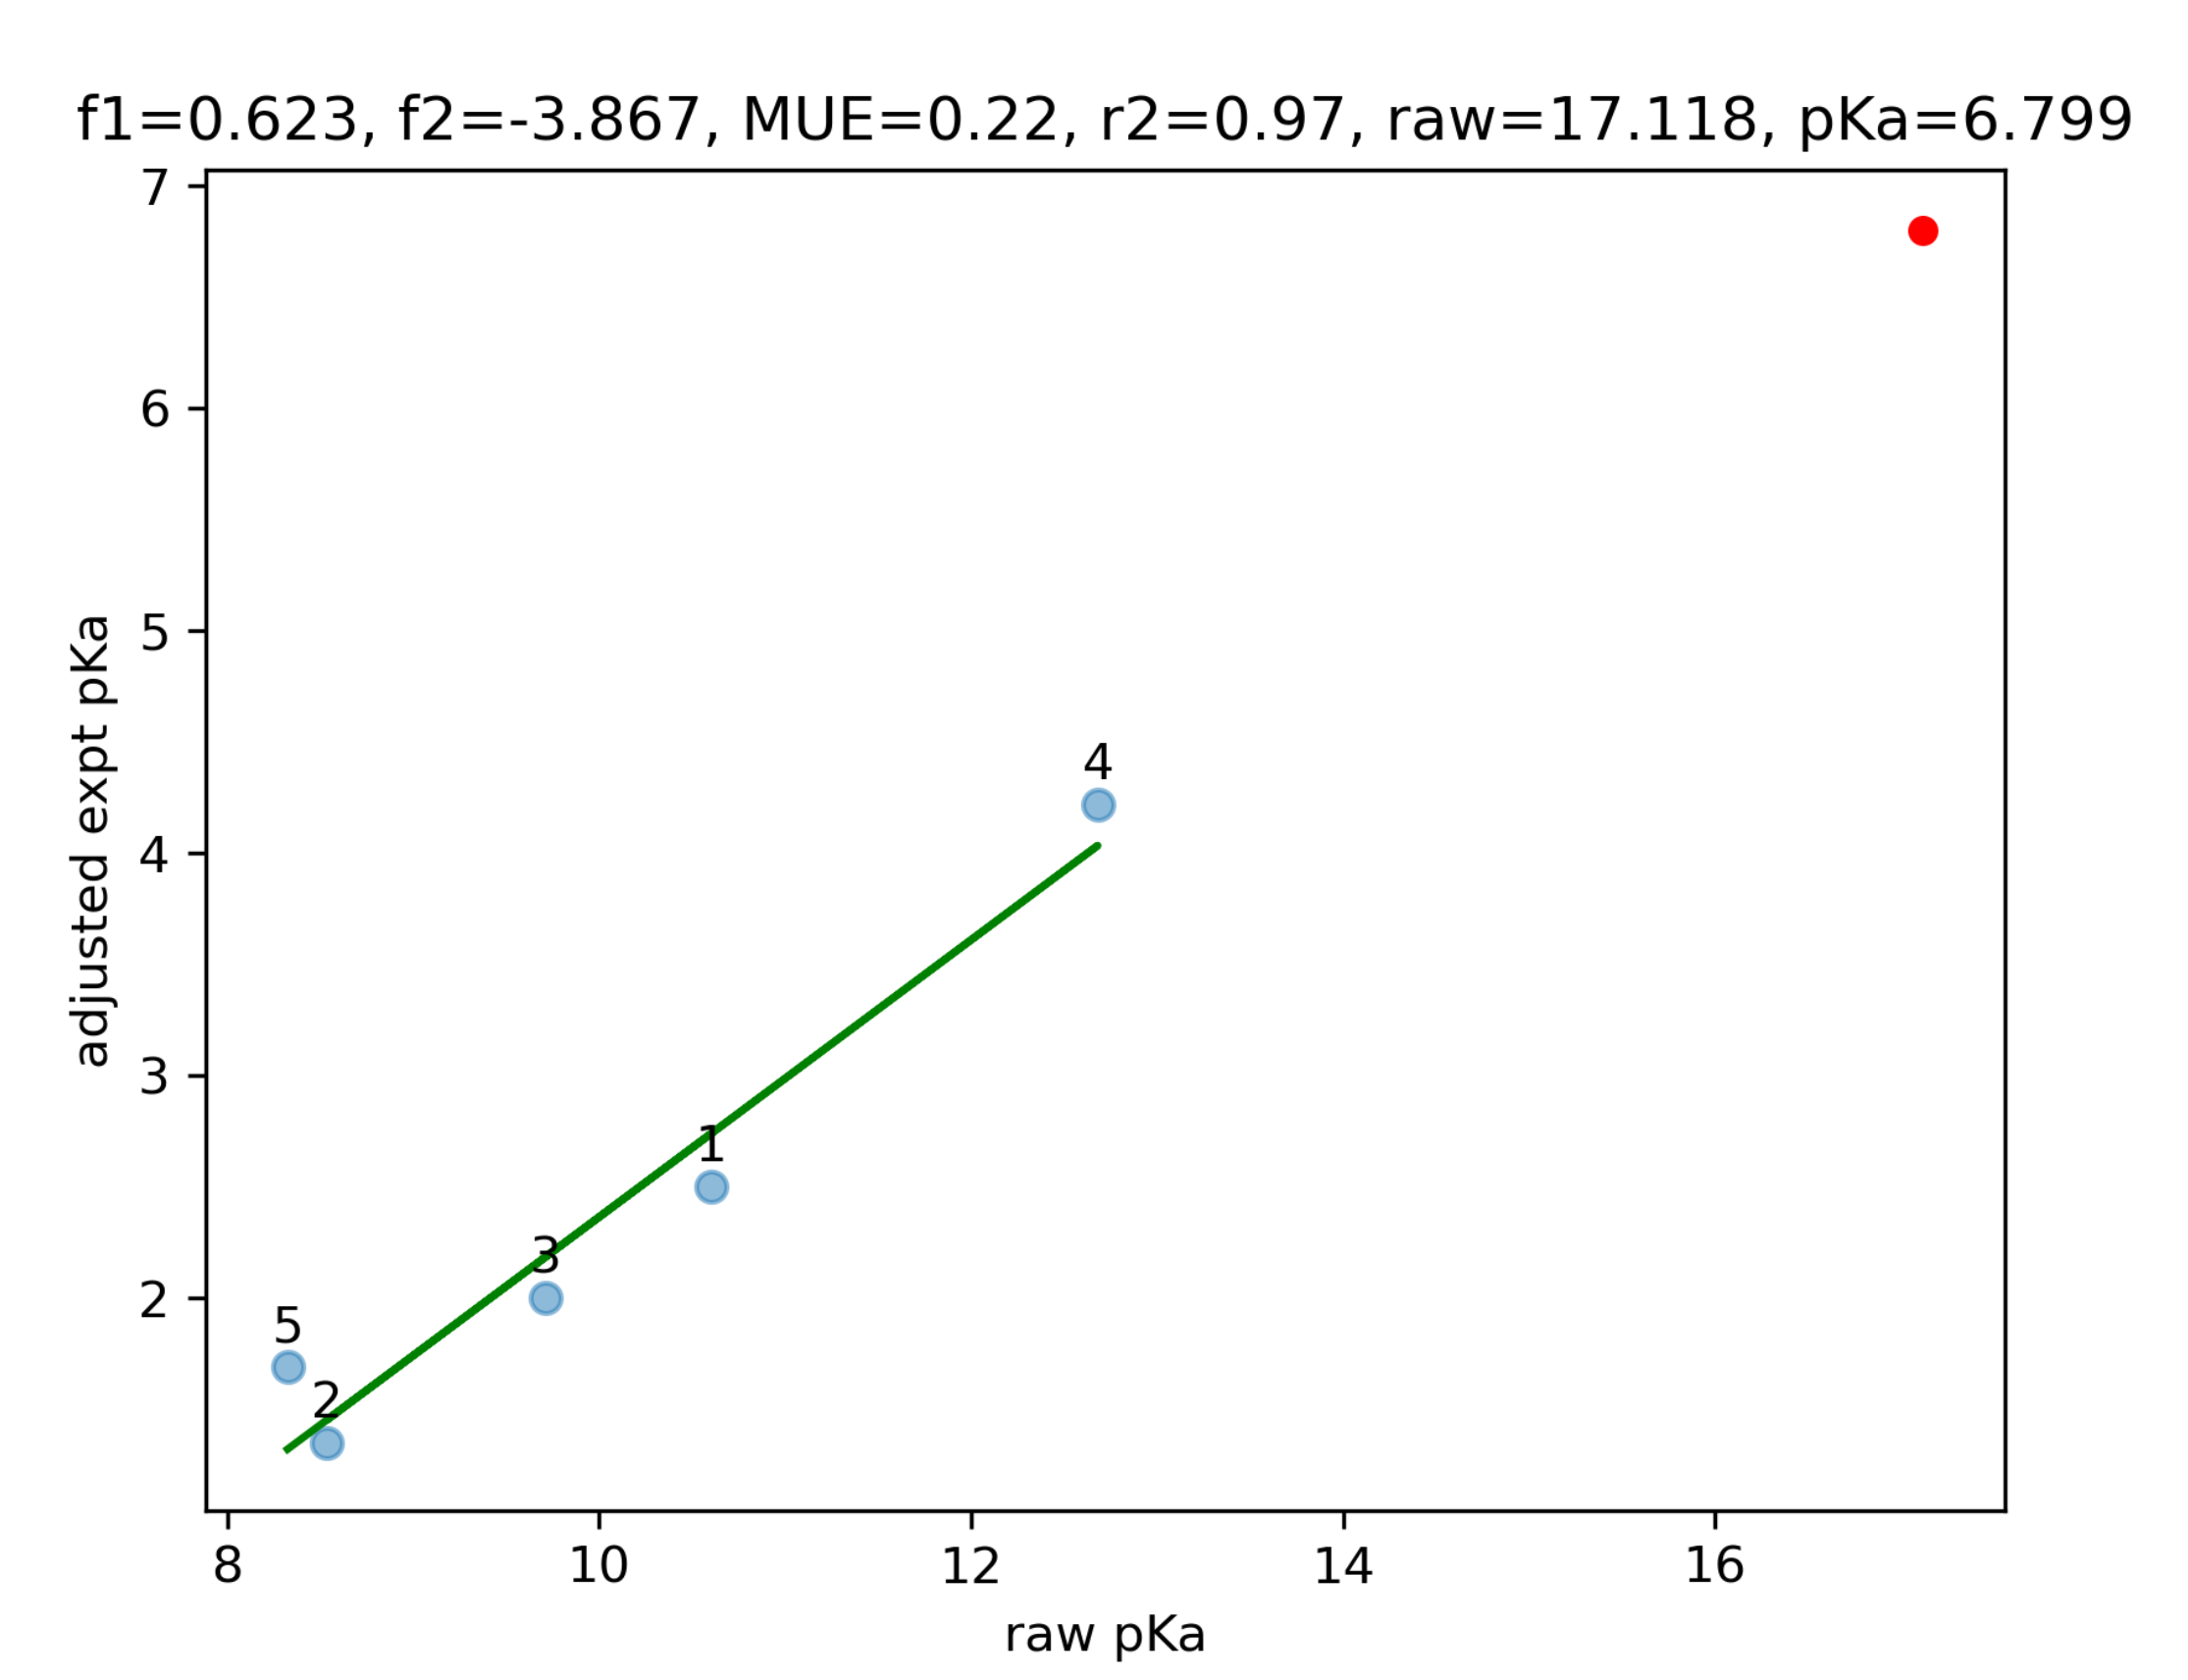
A graph plotting the raw pKa against the empirically corrected micro-pKa(adjusted expt pKa) shows the fit of the reference data points. Data for the tautomer is also plotted and is shown as a red dot.