Interactive H-Bond Optimizer Panel
This panel is used to interactively assign orientations of hydrogen-bonded groups in proteins (including waters), of the imidazole ring in His, and of the terminal amides in Asn and Gln.
- Using
- Features
- Additional Resources
Using the Interactive H-Bond Optimizer Panel
This panel can be used from the Protein Preparation Workflow Panel to check on the assignments of hydrogen orientations in the hydrogen-bonding network and the His, Asn, and Gln orientations. Each hydrogen bond donor, His ring, and Asn and Gln terminal amide is considered a separate orientable species. It can also be used from the PrimeX Panel to make assignments of these orentations, as most X-ray experiments cannot distinguish between the N and the O of terminal amides in Gln and Asn, and cannot determine the orientation or ionization state of the ring in His, or the orientation of water molecules.
The optimization works as follows. An attempt is made to find a single solution that alleviates all serious clashes within the network. A Monte Carlo algorithm is then used to sample orientations in each cluster.
To change the orientation of a particular species, select it in the table and use the arrow buttons to step through the possible states. You can also pick a species in the Workspace, by selecting Pick to locate species (at the foot of the panel) and picking an atom in the Workspace. The view zooms in to the species that is picked. You can step through species with the Up Arrow and Down Arrow keys. If you want to sort the species by state, click Sort By State. The sorted order remains in effect until you select a different cluster.
As with any automated procedure of this type, you should check the orientations after the assignment, to ensure that they are correct, or at least reasonable.
You might want to display crystal mates when you check the orientation of the residues near the surface of the protein. You can do this by choosing a range from the Crystal mates menu in the Workspace Configuration toolbox:

To check the hydrogen bonding, you can use the Interactions button menu on the Workspace Configuration toolbar.

The hydrogen bonds are displayed as dotted yellow lines. You can change the criteria for what is considered a hydrogen bond, in the Nonbonded Interactions Preferences of the Preferences Panel.
Note: You do not need to have hydrogens in the structure in order to optimize the H-bond networks. If the hydrogens are missing, they will be added when the new entry is created for the structure, and removed from the original structure when the optimization is complete.
Interactive H-Bond Optimizer Panel Features
- Analysis section
- View options
- Fit to Workspace button
- Optimize button
- Display result text box and buttons
- Species table
- Add Orientation button
- Sort by State button
- Pick to locate species option
- Analysis section
-
In this section you perform the analysis of the system into hydrogen-bonded clusters.
- pH text box
-
Set the pH value for determining the protonation state of protein residues. This choice affects the charge states used for certain residues.
- Use PROPKA option
-
Use PROPKA to predict the pKa values of the protein and determine the protonation state at the specified pH. If you deselect this option, a set of simple rules is used to determine the protonation states according to the pH range:
- very low—protonate ASP, GLU, HIS
- low—protonate HIS
- neutral—normal biological states
- high—deprotonate CYS
- Label pKas
-
Label protein atoms with their predicted pKa values.
- Analyze Network button
-
Analyze the hydrogen bonds in the structure, subject to the options that are selected in this section, to identify the species, cluster them and generate their states, which are then listed in the table. You must click this button when you first open the panel, or if you add or delete bonds or atoms in the Workspace or include a new structure in the Workspace. The analysis can take a minute or so, depending on the size of the system.
- Include current orientations option
-
Include the current orientations of the hydrogen-bonded species among the orientations to be sampled. This option ensures that the starting conformation is considered during optimizations, and is especially important when more than one serial optimization is applied.
- Only treat Workspace selection option
-
Restrict the scope of the analysis to the atoms that are selected in the Workspace.
- Use crystal symmetry option
-
When analyzing the Workspace structure, use crystal symmetry to include in the analysis any H-bonds to atoms in neighboring cells. This can be important if only part of the biologically-relevant structure is present in the asymmetric unit. Using this option can significantly increase the time taken in the optimization.
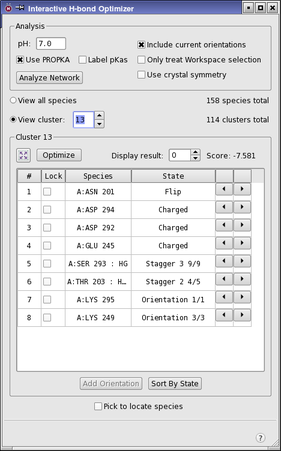
- View options
-
There are two options for display of species in the species table, with relevant controls. The content of the species table depends on the option that is selected.
-
View all species—list all species in the table. The number of species is given to the right of this option.
-
View cluster—list the species for the specified cluster in the table. You can enter the desired cluster number in the text box, use the arrow buttons to step through clusters one at a time, or use the double-arrow buttons to go to the beginning or end of the cluster list. The number of clusters is given to the right of this option. When you select a cluster, the Workspace view zooms in to the cluster, its carbon atoms are colored green, and any alterations to the state are labeled. The H-bonds in and to the cluster are also shown in the Workspace.
-
- Fit to Workspace button
-
This button zooms in on the cluster so that the cluster fills the Workspace.
- Optimize button
-
Optimize the orientations of the species listed in the table. The optimization does not vary any species for which a lock is set by selecting the Lock option for that species in the table.
When you optimize a cluster, multiple results are returned, ordered by score. Each result corresponds to a particular combination of states for the species in the cluster. The result with the best score is displayed in the table by default.
When the optimization has finished, the Display result controls become available.
- Display result text box and buttons
-
The text box shows the index of the result that is displayed in the Workspace. The index starts from 0, for the lowest (best) score, and the results are ordered by score. To change the display, you can enter an index in the text box, or use the arrow buttons to step through the results. When you change the result that is displayed, the orientation of the species in the Workspace is changed, and the State column of the species table is updated to indicate which state of each species is represented in the chosen result. The score for the result is displayed to the right of the text box, and is updated as you step through results for the cluster or manually change the state via the species table.
- Species table
-
This table lists the orientable species for the choice of view made at the top of the panel. The table is noneditable, but can be used to select a species to change its orientation. You can select a single row of the table to adjust the orientation of the species. The UP ARROW and DOWN ARROW keys can be used move the selection up and down the table.
When you select a row, the species is centered in the Workspace and the view zooms in to that species, whose carbon atoms are colored green, and a label is added if its orientation has changed. The H-bonds in and to the cluster are also shown in the Workspace.
The table is deactivated if you delete or add atoms or bonds in the Workspace. The species and their states can be recalculated by using the Analyze Network button.
The table columns are as follows:
# Index of species, relative to the full list or the cluster, depending on the choice of view option. Lock Option to lock the orientation of the species at the current state. The space bar can be used to lock or unlock the orientation. When you lock the orientation, it is not changed when you click Optimize. If you manually change the state, the lock does not lock the manually-adjusted state but the original state. You can add a manually-adjusted state to the set of states for the species with the Add Orientation button. Species Identity of species, given as the chain name followed by a colon, the residue name and number, and another colon and the atom name if a rotatable hydrogen is involved. State This column indicates the state of the species: - For GLN and ASN, the two states are Flip and No Flip, which describe how the orientation of the terminal amide has changed from the input structure.
- For HIS, the protonation state is given by the residue name, preceded by the word Flip if the orientation of the ring has changed from the input structure.
- For hydrogens, the states is described by Orientation i/n, where i is the index of the particular orientation, and n is the number of orientations.
Arrow buttons These buttons allow you to cycle through the states for the selected species. - Add Orientation button
-
Adds the current orientation of the species to the list of states. The states added using this button are labeled User n, where n is an index that starts from 1. This button allows you to perform manual adjustments in the Workspace, and have those adjustments included for sampling and locking.
This button is only available for rotatable hydrogens and waters.
- Sort by State button
-
Sort the table by the values in the State column. The sorting is temporary: if you switch to display a different cluster or to display all species, then the sort must be re-applied.
- Pick to locate species option
-
Select this option to pick an atom in the Workspace that belongs to a species of interest. The cluster that the species belongs to is loaded into the species table. The species is selected and centered in the Workspace, its carbons colored green, and labeled if its orientation has changed.