Ramachandran Plot Panel
This panel displays a Ramachandran plot of the protein dihedrals φ and ψ for each residue in the protein that is displayed in the Workspace.
To open this panel: click the Tasks button and browse to Structure Analysis → Ramachandran Plot.
- Using
- Features
Using the Ramachandran Plot Panel
This panel is useful for identifying residues that fall in disallowed regions of protein dihedrals, so that adjustments can be made to the protein geometry. Once you have adjusted the geometry, click Refresh to redisplay the plot. You can only display a plot for one entry at a time.
Ramachandran Plot Panel Features
- Plot toolbar
-
The toolbar has tools for manipulating the plot and for saving images. The buttons that are common to all plot toolbars are described in the Plot Toolbar topic.
- Ramachandran plot
-
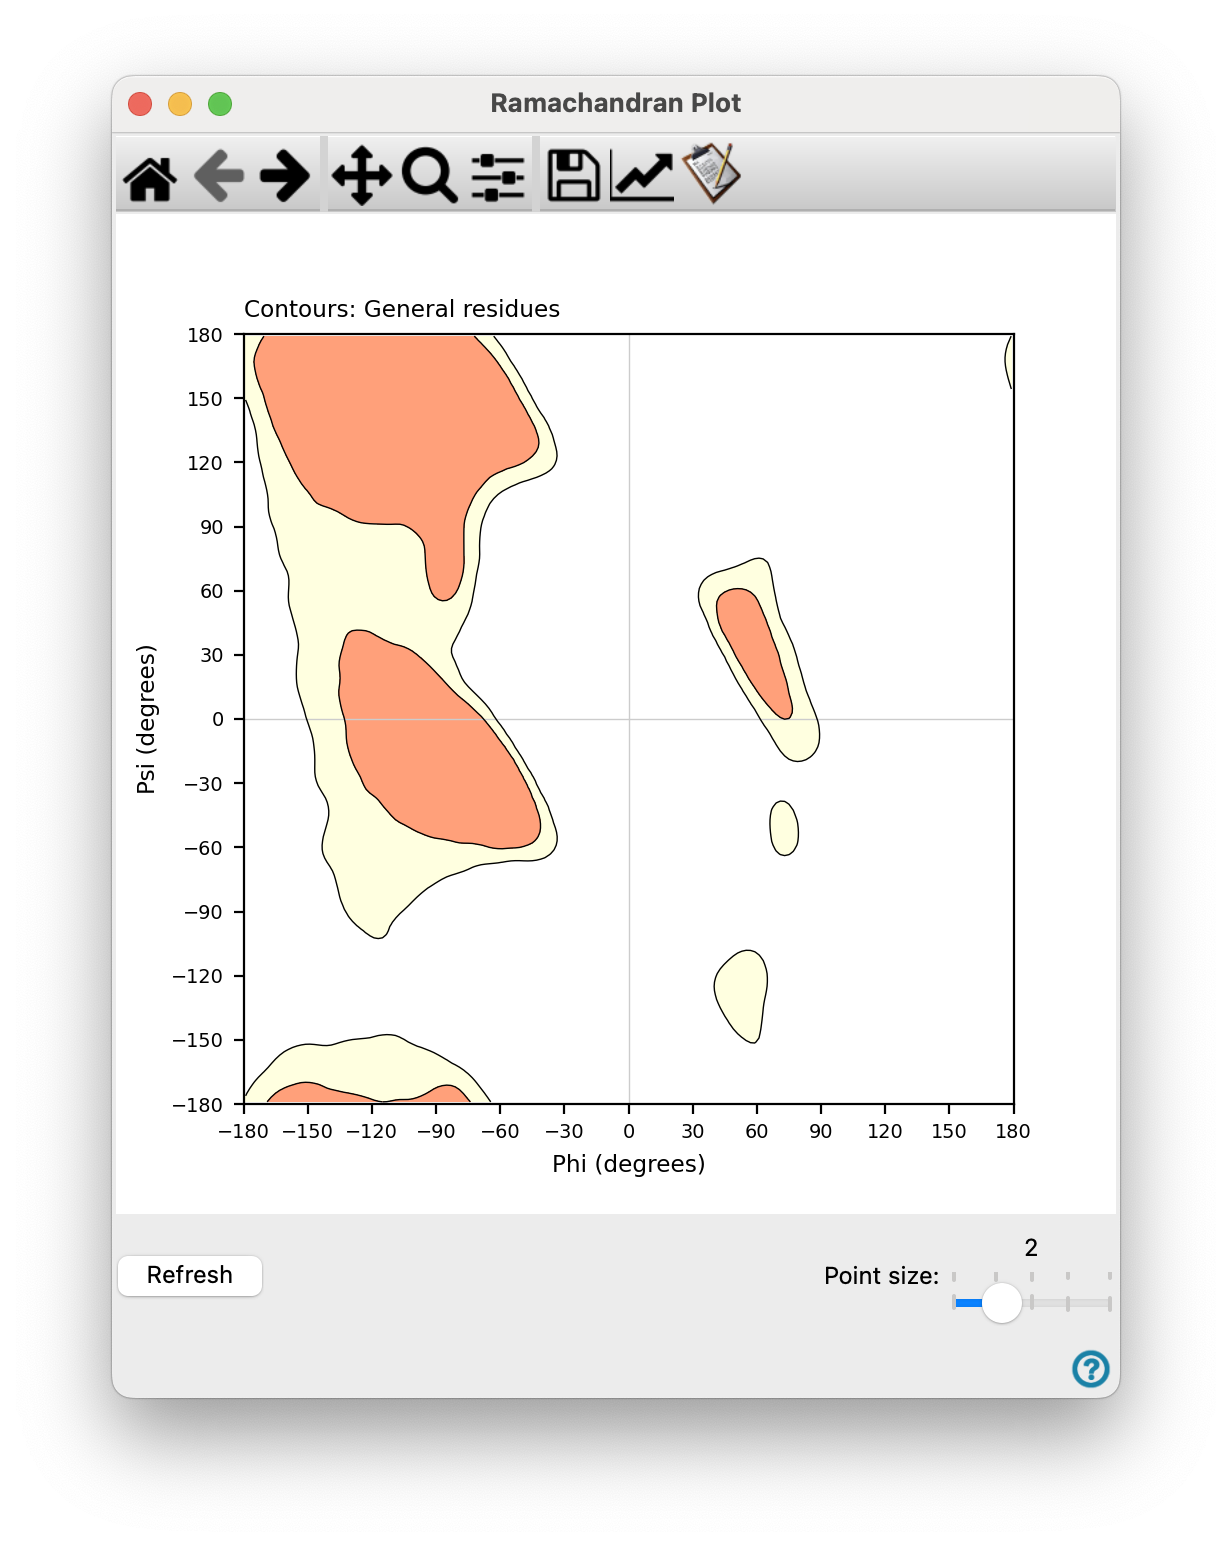
The plot area displays a plot of protein dihedrals for all residues in the protein. The plot has the following features:
-
Glycine is plotted as triangles, proline is plotted as arrows, pre-proline is plotted as squares, isoleucine/valine is plotted as diamonds, and all other residues are plotted as circles.
-
The orange regions are the "favored" regions, the yellow regions are the "allowed" regions, and the white regions are the "disallowed" regions.
-
Pausing the pointer over a point displays information for that residue at the top of the panel, and highlights the residue in the Workspace sequence viewer. If another point is selected, the information for the selected point is replaced while the pointer is over the current point, and returns when the pointer moves off the current point.
-
Clicking on a point selects the point, zooms the Workspace image in to that residue, and highlights it with pale yellow markers. The point is displayed as an outline instead of solid black. The residue information is displayed at the top of the panel.
-
- Refresh button
-
Reanalyze the protein and redisplay the plot.
- Point size slider
-
Use this slider to adjust the size of the points in the plot.