Sample Site Maps
To illustrate a typical application, Figure 1 and Figure 2 show the co-crystallized ligand for the thrombin 1ett receptor and the generated site points (white) in the context of the receptor structure and of the gray, translucent SiteMap surface. Figure 1 focuses on relatively exposed regions of the site, while Figure 2 profiles the buried specificity pocket.
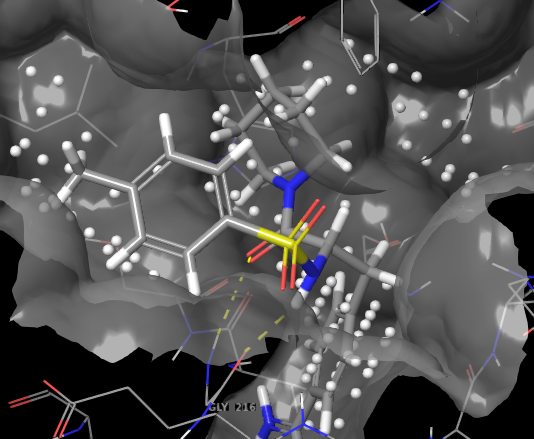
Figure 1:SiteMap surface and site points for 1ett, exterior of pocket
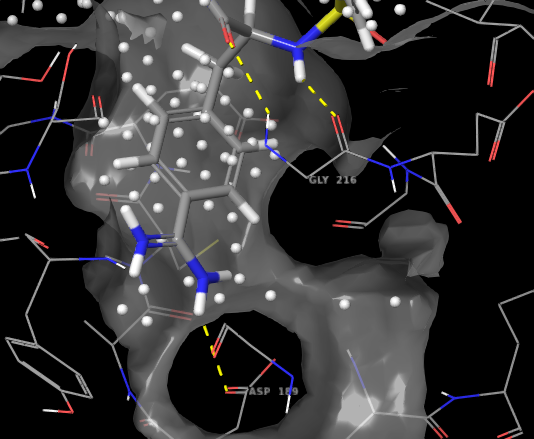
Figure 2:SiteMap surface and site points for 1ett, inside pocket
Figure 3 and Figure 4, taken from the same viewpoints, display the hydrophobic (yellow) and the hydrogen-bond donor (blue) and acceptor (red) maps, but for clarity suppress the receptor surface. The hydrophobic groups on the ligand can clearly be seen occupying hydrophobic regions, and the donors and acceptors of the ligand are located in or very close to the appropriate donor and acceptor regions.
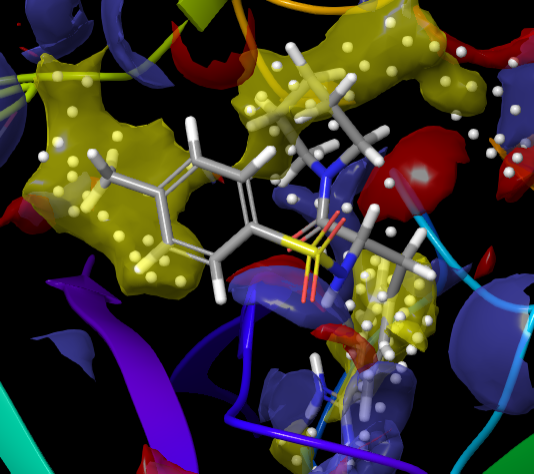
Figure 3:Hydrophobic, donor, and acceptor maps for 1ett, exterior of pocket
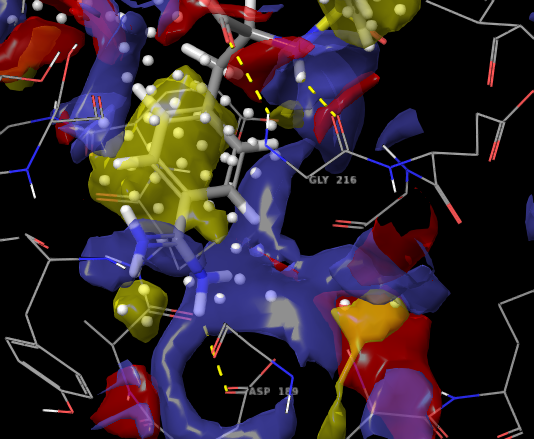
Figure 4:Hydrophobic, donor, and acceptor maps for 1ett, inside pocket