Desmond performance data for supported cards
Choosing the right hardware is crucial for maximizing the efficiency and throughput of your Desmond Molecular Dynamics (MD) simulations. This page provides Desmond performance benchmarks for Schrödinger supported NVIDIAGPUs.
The goal of these benchmarks is to help you select the optimal GPU hardware for your specific performance needs and budget constraints. All benchmarks were run using standard Desmond input files for two common biological systems:
-
DHFR: Dihydrofolate reductase in a water box (~24,000 atoms).
-
FACTOR IX: The zymogen Factor IX in a water box (~93,000 atoms).
1. Raw Simulation Performance
The first benchmark measures the raw simulation speed, or the number of nanoseconds of simulation that can be completed in a 24-hour period (ns/day).
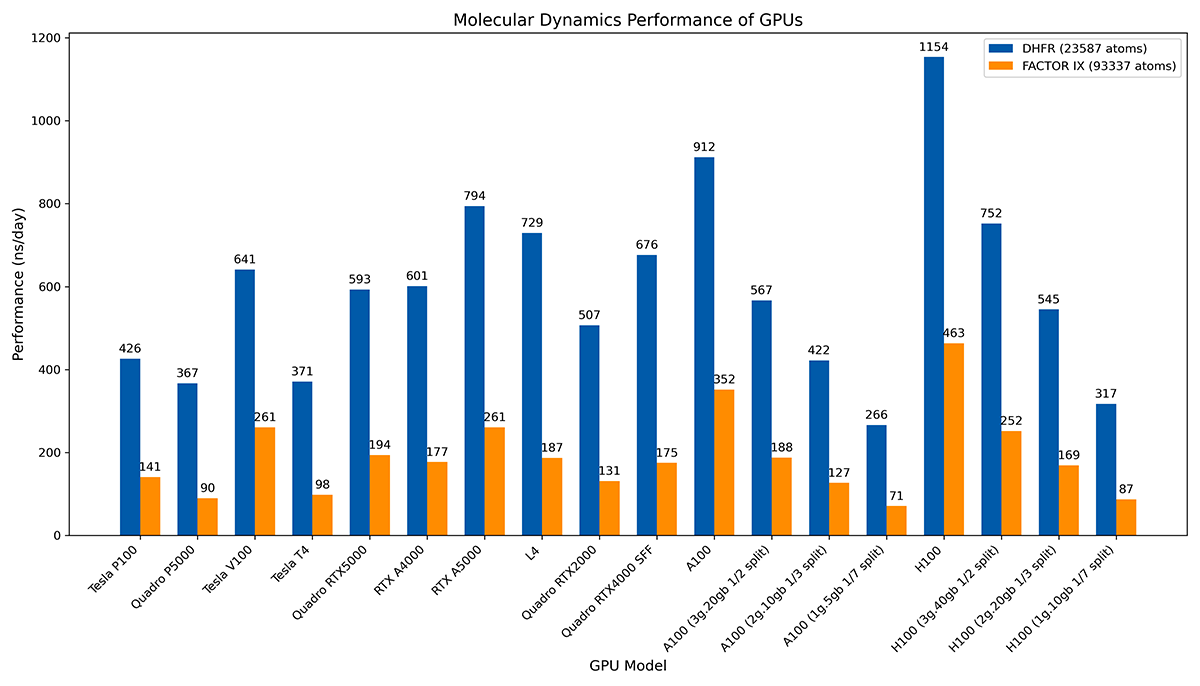
Figure 1: Raw performance of various NVIDIA GPUs on the DHFR (blue) and FACTOR IX (orange) systems measured in ns/day. Higher values indicate better performance.
Benchmarks were run with release version 2026-1.
2. License-Normalized Performance
While raw speed is important, Desmond simulations also require license tokens to run. MD simulations run on different GPUs consume a different number of Desmond license tokens (see License Usage per GPU), which has an impact on the total cost of running simulations.
The license-normalized benchmark provides a measure of performance efficiency. It adjusts the raw performance based on the number of license tokens required by each GPU, offering a "performance-per-token" value.
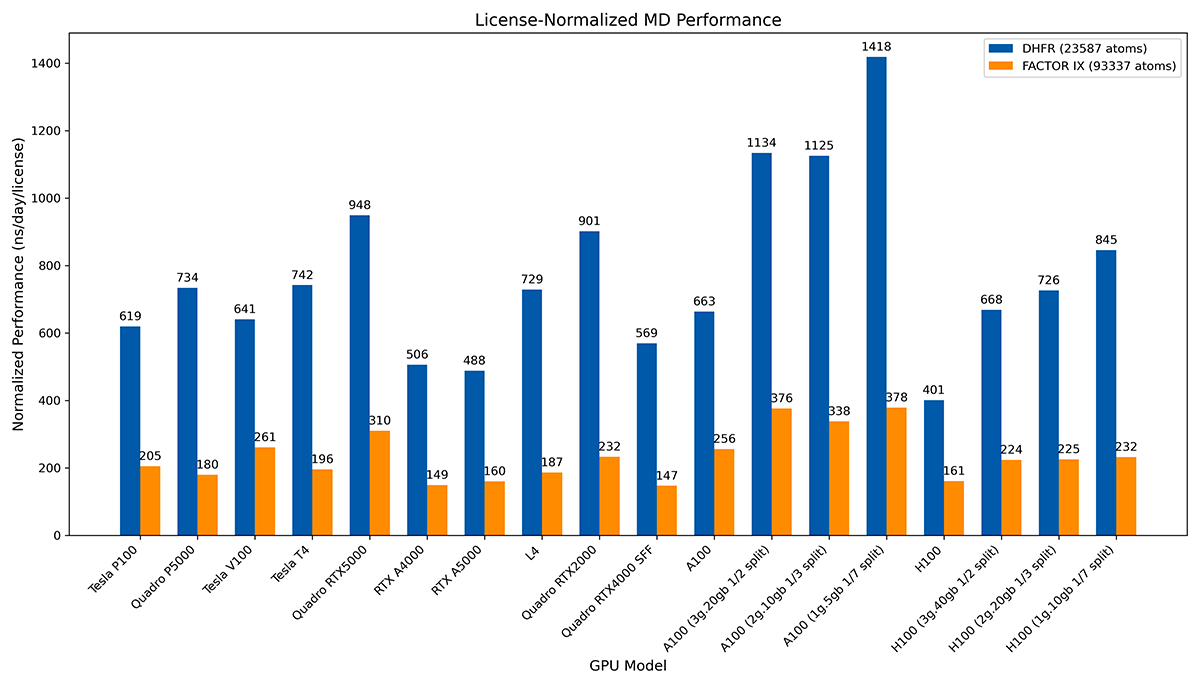
Figure 2: License-normalized performance of various NVIDIA GPUs on the DHFR (blue) and FACTOR IX (orange) systems measured in ns/day/license. This metric shows the simulation speed weighted by the number of Desmond license tokens used. Higher values indicate better performance efficiency.
Benchmarks were run with release version 2026-1.