FEP+ performance data for supported cards
Free Energy Perturbation (FEP) calculations occur on time scales that are computationally demanding to simulate. The advent of GPU computing has opened the door to a new world of computationally intensive simulations that would not have been possible even a few years ago.
When choosing a GPU card, there are a number of factors to consider including price, availability (both for on-prem and cloud usage), power consumption, license usage, and performance throughput. We provide performance data for a single Relative Binding FEP system (BACE1, ~36,900 atoms) that is available in our tutorial, BACE1 Inhibitor Design Using Free Energy Perturbation.
It must be noted that other types of FEP+ (AB-FEP, Solubility FEP) and other properties of either the individual perturbations or of the chemical systems will affect these timings. These properties can sometimes be changed either directly by the user (e.g., simulation time, number of lambda windows) or by our automated setup choosing the most appropriate parameters for your system.
1. Raw FEP+ Performance
This benchmark measures the raw FEP+ calculation speed, measured in the number of map perturbations/day. This metric is the best indicator of pure computational throughput for FEP+.
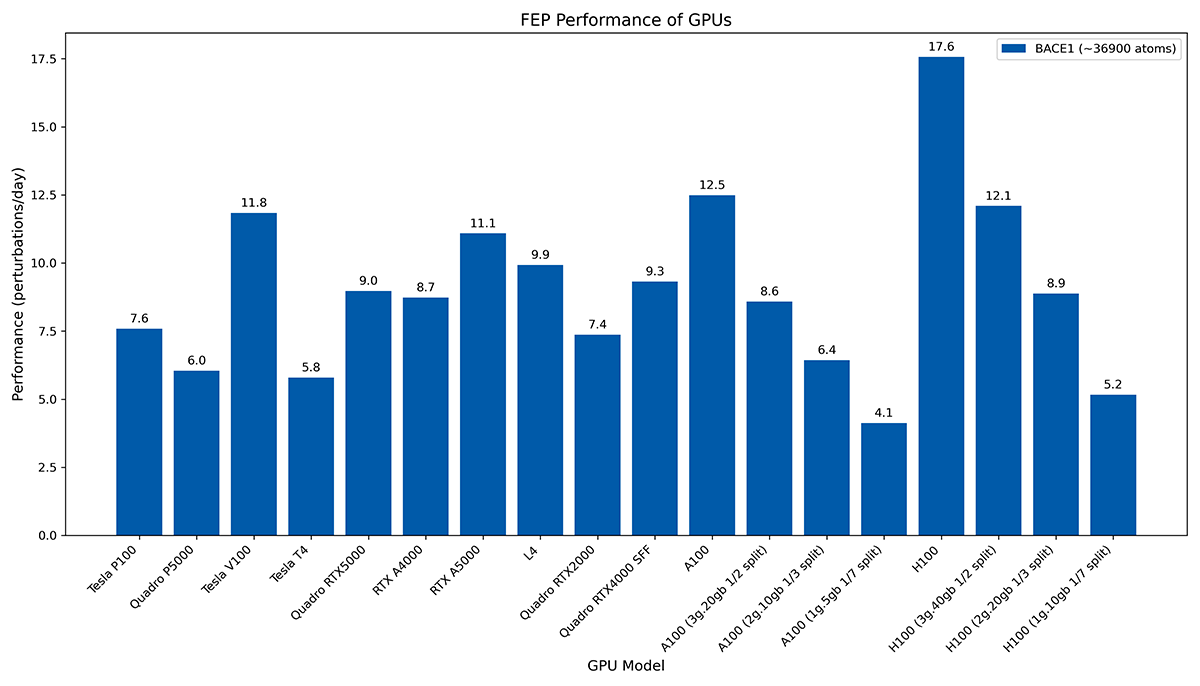
Figure 1: Raw FEP+ performance of various NVIDIA GPUs on the BACE1 system measured in perturbations/day. Higher values indicate better performance.
Benchmarks were run with release version 2026-1.
2. License-Normalized FEP+ Performance
FEP+ calculations run on different GPUs consume a different number of FEP+ license tokens (see License Usage per GPU), which has an impact on the total cost of running FEP+ calculations.
The license-normalized benchmark provides a measure of performance efficiency. It adjusts the raw performance based on the number of license tokens required by each GPU, offering a "performance-per-token" value.
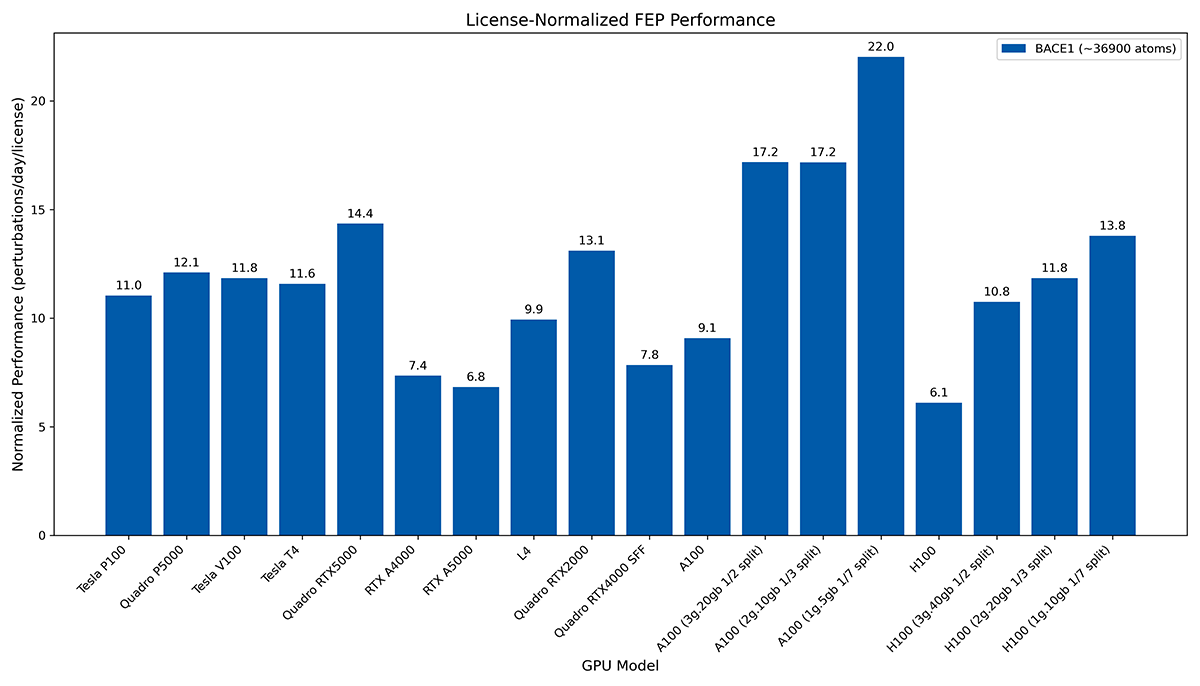
Figure 2: License-normalized FEP+ performance of various NVIDIA GPUs measured in perturbations/day/license. This metric shows the simulation speed weighted by the number of FEP+ license tokens used. Higher values indicate better performance efficiency.
Benchmarks were run with release version 2026-1.