Band Structure Viewer Panel
Plot the band structure from a periodic DFT calculation.
To open this panel, click the Tasks button and browse to Materials → Quantum Mechanics → Quantum ESPRESSO → Band Structure Viewer.
To open this panel from the entry group for the results of a Quantum ESPRESSO job .
.
The following licenses are required to use this panel: MS Maestro, Quantum Espresso Interface
- Features
- Additional Resources
Band Structure Viewer Panel Features
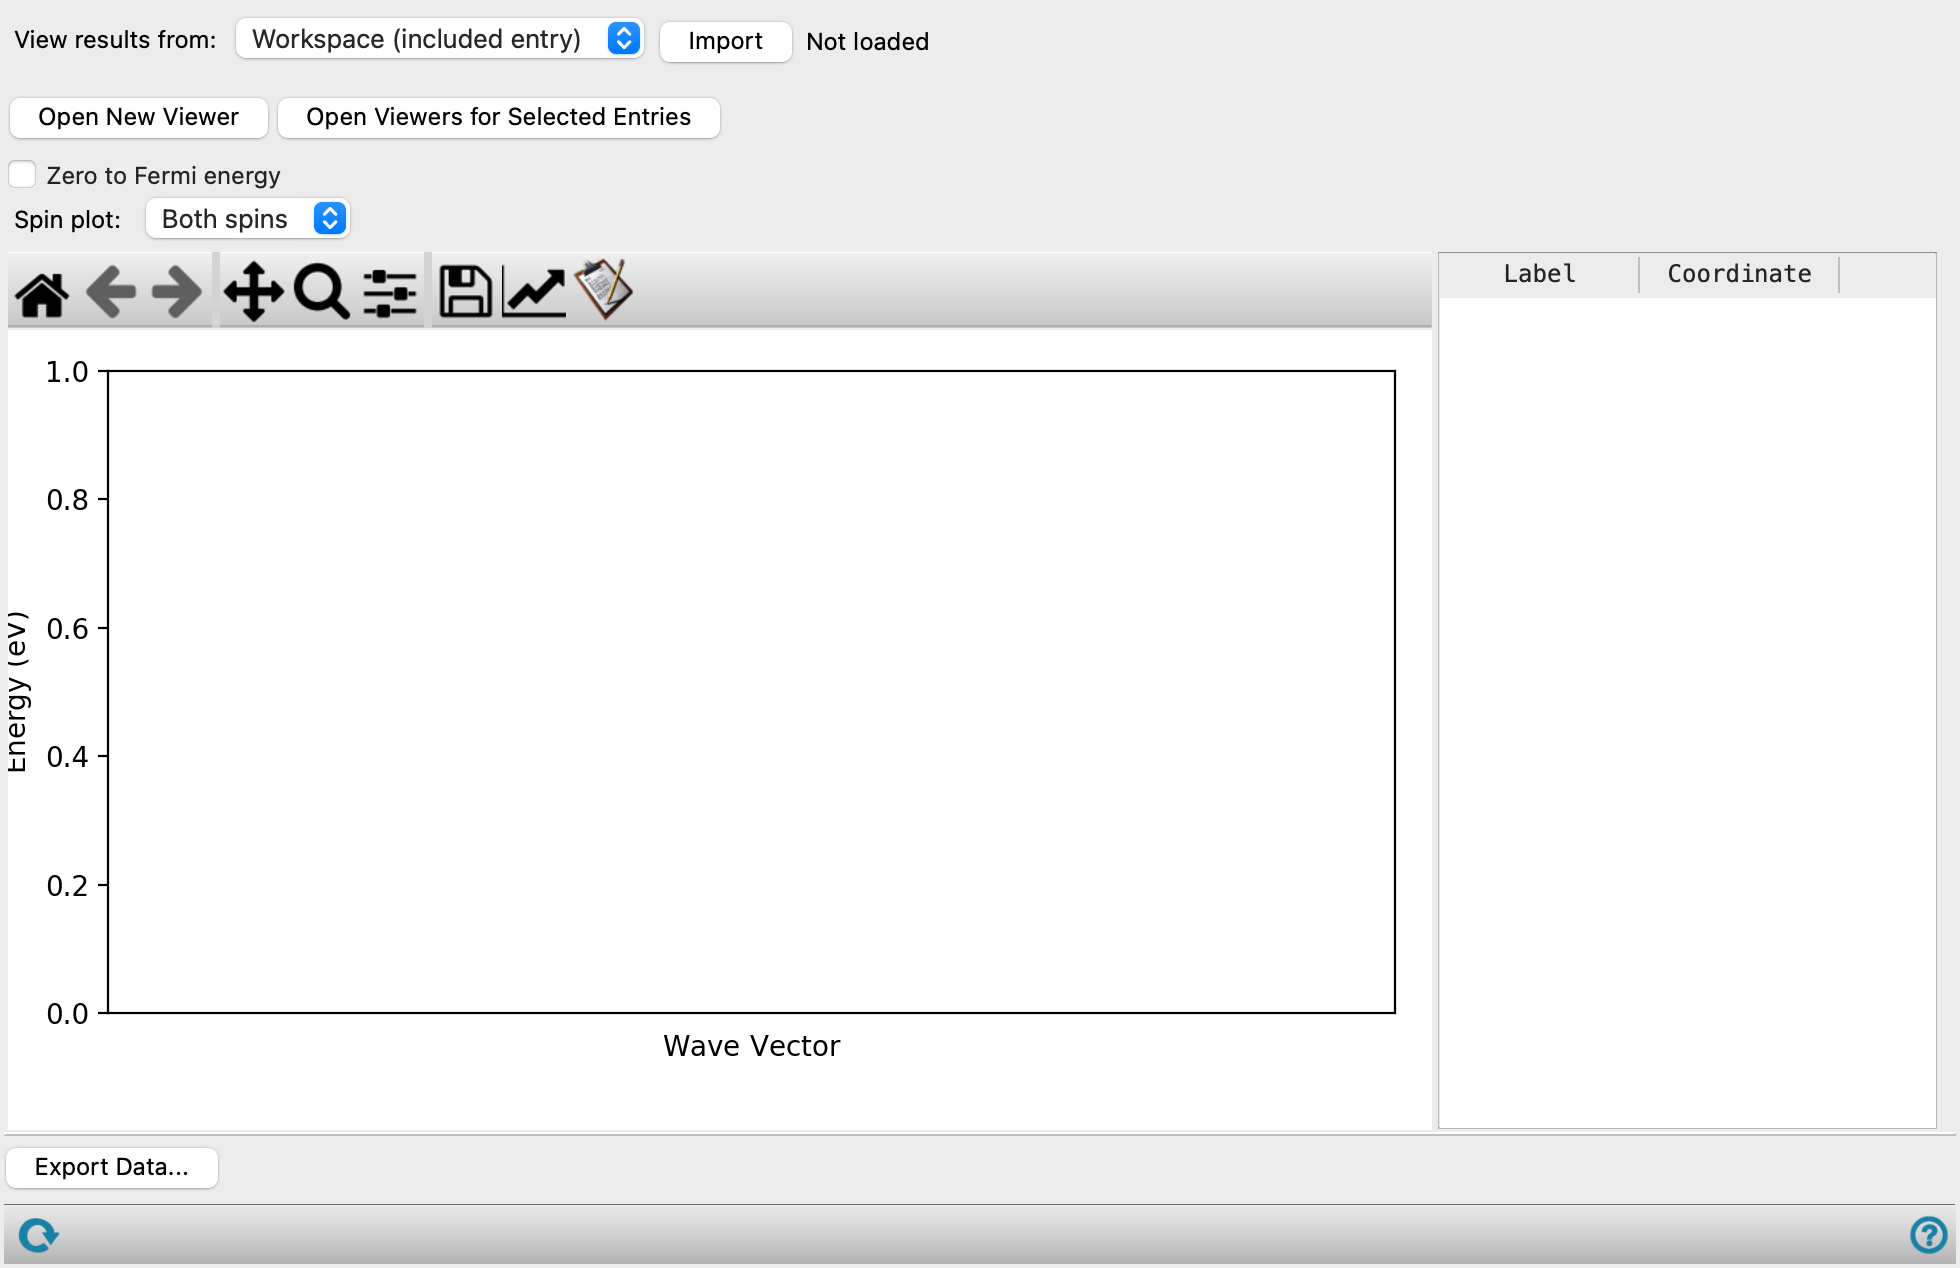
- View results from option menu
-
Choose the structure source for the display of band structure.
- Workspace (included entry)—Use the entry that is currently included in the Workspace. Only one entry must be included in the Workspace. When this option is selected, the Import button is displayed.
- File—Use the specified file. When this option is selected, the Browse button is displayed.
- Import button
-
Click Import to load the included entry from the Workspace into the viewer. The name of the included entry is displayed to the right of the button.
- Browse button
-
Click Browse and navigate to the file
- Open New Viewer button
-
Open a new viewer so you can display a different band structure plot.
- Open Viewer for Selected Entries button
-
Select entries in the Entry List or Project Table, then click this button to open a viewer for each entry. This allows you to view plots for related structures and data.
- Zero to Fermi energy option
-
Set the zero of energy to the Fermi energy. The vertical axis label is changed to reflect this choice. If this option is not set, a black horizontal line is drawn at the Fermi energy.
- Export Data button
-
Export data to a CSV file. The data includes the Fermi level; labels, fractional and plotting coordinates of various points (e.g. Γ, X, etc.), the wave vector and values of the spin-up and spin-down band energies at each value of the wave vector. Opens a file browser so you can specify the file.
- Spin plot option menu
-
Choose the spins for which the band structure is plotted, from Both spins, Spin up, or Spin down.
- Plot toolbar
-
The toolbar has tools for manipulating the plot and for saving images. The buttons that are common to all plot toolbars are described in the Plot Toolbar topic.
- Plot area
-
This area displays the band structure. When the band structure for both spins from a spin-polarized calculation is plotted, the spin-up band structure is plotted in red, the spin-down band structure is plotted in blue. Labels are added to the horizontal axis for points in reciprocal space (such as G or X), and their coordinates are listed in a table next to the plot as fractional reciprocal coordinates.
- K-points table
-
This table lists the k-points used as edge points to calculate the band structure. You can make your own selection of k-points for the band structure in the Quantum ESPRESSO Calculations - Advanced Options Dialog Box, when you set up the job.