Digitize Curves Panel
Digitize curves or scatter plots from an image to produce coordinates of the curve or points, and export the results in CSV format. The primary intended purpose of this panel is to obtain experimental spectra from images, which can then be used for comparison with predicted spectra, for example.
To open this panel: click the Tasks button and browse to Materials → Tools → Digitize Curves.
The following licenses are required to use this panel: MS Maestro
- Using
- Features
- Additional Resources
Using the Digitize Curves Panel
The basic procedure for digitizing a curve is as follows:
- Import an image of the curve into the panel.
- If the image is not rectangular, use the Slanted image tab to transform it to a rectangular image
- Calibrate the image by picking points on the x and y axes and entering the values for these points.
- Set up parameters for automatically picking points on a curve (such as color and tolerances), and click Auto-pick Points.
- Export the points to a CSV file, or copy and paste them to another location as a table.
If you want data for multiple curves on the same plot, you should export them one at a time, i.e. pick points on the first curve, export the data, then clear the data from the first curve by clicking All Points. You can then pick points for the next curve. If you don't clear the data, the points from the new curve are merged with the points from the old curve, averaged for common x values, if any, and a single curve with data from both is exported. Note that, due to the picking of points by color, there is no guarantee that the same x values are in all curves, even from a single multi-curve plot, so any merging of curves is not recommended.
Digitize Curves Panel Features
- Browse button
-
Click this button to browse to an image file. Opens a file selector. When you open the file, the file name is displayed to the left of the button and the image is displayed in the display area. Any existing data is cleared, including calibration data and data points, but settings in the Auto-pick points tab are kept.
- Zoom text box
-
Set the zoom percentage for the displayed image. Scroll bars are shown if the zoom makes the image larger than the display area. You can also use the scroll wheel on the mouse to zoom in and out.
- Fit In View button
-
Fit the image to the display area. This updates the Zoom text box with the new zoom value.
- Display area
-
This area displays the image. You can click on points in the display area to provide (x,y) data for use in the digitization process. Points that you pick are displayed as small red dots with a green border. Using the mouse wheel zooms in and out.
- Pointer area enlargement
-
This box shows an enlargement of the area under the pointer (cursor), and is useful for precise positioning of the pointer.
- Slanted image tab
-
This tab is used for defining the corners of a slanted image, which you can then convert to a rectangular image. The task to perform in this tab is to pick the corners of the image.
- Corner Pick buttons
-
Click one of the buttons to pick a point on the plot for the specified corner. The picked point is displayed as normal. If you click the button and pick a point again, the new value of the coordinates of the corner replace the ones from the previous pick.
- De-slant button
-
Convert the image to a rectangular image using a perspective transformation. Once you have converted the image, you can proceed to calibration of the axes of the image.
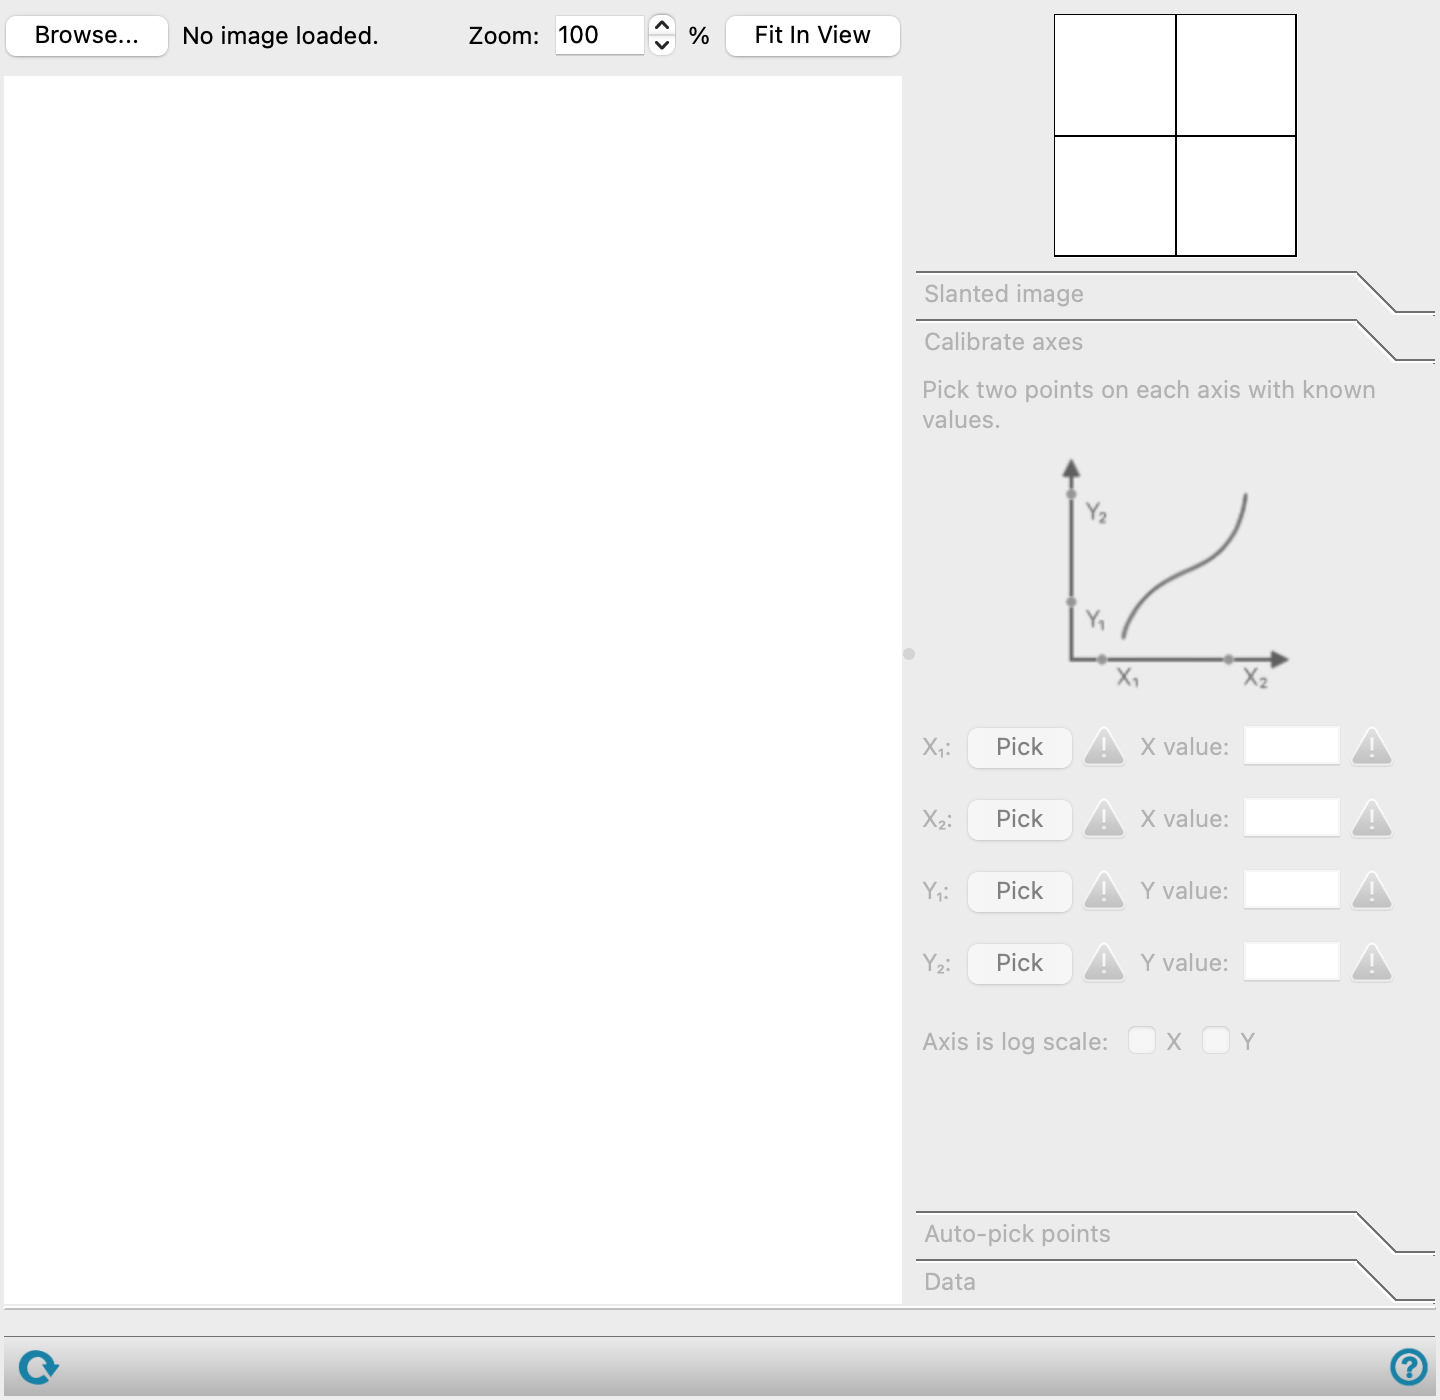
- Calibrate axes tab
-
Use this tab to map points on the axes to axis values, so that the digitized points can be converted to x and y values.
- Axis point Pick buttons
-
Click this button to pick a point on the relevant axis. The positioning perpendicular to the axis does not matter, as only the position along the axis determines the point to which a value is assigned.
- Axis value text box
-
Enter the axis value for the picked point into the text box. When the value is entered a check mark is displayed to the right, to indicate that the picked point has been assigned the entered value.
- Axis is log scale check boxes
-
Check the relevant box to indicate that an axis has a logarithmic scale rather than a linear scale.
- Auto-pick points tab
-
Make settings for automatic picking of points.
- Select Region button
-
Select a rectangular region in the display area to limit the automatic picking of points. The region is marked in the display area. Click the button again to remove the selected region, and again to exit selection of a region.
- Curve color button
-
Click the button to open a color selector for the color of the curve you want to digitize. You can pick the color from the plot with the tools in the color selector.
- Options section
-
Set options for picking the points.
- Tolerance slider
-
Determines how close a pixel color has to be to the selected color to be considered a match. Large values can result in points on curves with different colors being auto-picked. Small values can result in few points being auto-picked. The default of 0.1 does not distinguish red and orange, for example, but 0.05 does.
- Point spacing slider
-
Determines the horizontal step when iterating over the image or region's pixels to find matches. The values shown are on a scale of 1 to 100, and are proportional to the step in x.
- Symbol tolerance slider
-
Determines how close a data point has to be to a symbol to be considered a part of that symbol. Large values can cause close or overlapping symbols to be considered one symbol. Small values can cause each symbol to have more than one data point.
- Auto-pick symbols option
-
If the plot consists of symbols rather than lines (as in scatter plots), the picking algorithm groups all points on each symbol together, and adds an average point to the plot so there is only one point per symbol.
- Auto-pick Points
-
Run the automatic picking of points. The picked points are marked in the display area, and listed in the Data tab.
- Data tab
-
This tab displays the data and allows you to add or remove points, then export the result. The (x, y) coordinates of the data points are listed in ascending order of x. When using the buttons to pick or select points, only one of the buttons can be active at a time; clicking a button deactivates any other button that is active.
- Add Points section
-
Add points to the data set using the button in this section.
- Delete points section
-
Delete points from the data set using these buttons.
- Pick Points button
-
Click this button to start picking points on the plot to delete from the data set. The button is highlighted to indicate that you can pick points to delete. Click the button again to finish picking points.
- Select Region button
-
Click this button to allow dragging out a rectangular region in the display area to delete the points inside the region. The button is highlighted to indicate that you can drag over points to delete. Click the button again to finish deleting points by selecting a region.
- All Points button
-
Delete all picked points. The table of (x, y) data is cleared.
- Data precision text box
-
Specify the number of decimal places to show in the data. The values in the table are updated as you change the precision. The precision you set is used when you export the data or copy it to the clipboard.
- Table of points
-
This table shows the x and y coordinates of the picked points.
- Deduplicate data option
-
If this option is selected, each x coordinate in the table of points is represented only once, and points picked at the same x value (to the precision specified) are averaged when the data is copied or exported. If this option is not selected, points picked at the same x value (to the precision specified) are saved as distinct rows when copied to the clipboard or exported.
- Copy to Clipboard button
-
Copy the data to the clipboard for pasting in some other location.
- Export button
-
Export the data to a CSV file. Opens a file selector so you can navigate to a location and name the file.
- Status bar
-
 to reset the panel to its default settings and clear any data from the panel.
If you can submit a job from the panel, the status bar displays information about the current job settings and status for the panel. The settings include the job name, task name and task settings (if any), number of subjobs (if any) and the host name and job incorporation setting. The job status can include messages about job start, job completion and incorporation.
The status bar also contains the Help button
 , which opens an option menu with choices to open the help topic for the panel (Documentation), launch Maestro Assistant, or if available, choose from an option menu of Tutorials. If the panel is used by one or more tutorials, hover over the Tutorials option to display a list of tutorials. Choosing a tutorial opens the tutorial topic.