Optoelectronic Film Properties Viewer Panel
dipole moment, order parameter, singlet exciton energy transfer, seet, intersystem crossing, isc, refractive index, extinction coefficient, ellipsometry
Plot the results from an optoelectronic film properties calculation including transition dipole moment order parameter, single exciton energy transfer, intersystem crossing, refractive index, and extinction coefficient.
To open this panel: click the Tasks button and browse to Materials → Quantum Mechanics → Optoelectronic Film Properties → Optoelectronic Film Properties Viewer
To open this panel from the entry group for the results of a job .
.
The following licenses are required to use this panel: MS Maestro
- Features
- Additional Resources
Optoelectronic Film Properties Viewer Features
- Load from Workspace button
- Transition dipole moment order parameter tab
- Singlet exciton energy transfer tab
- Singlet-triplet intersystem crossing rate tab
- Intersystem crossing rate data text
- Singlet state option menu
- Singlet state energy text box
- Triplet state option menu
- Triplet state energy text box
- Temperature text box
- ISC reorganization energy text box
- RISC reorganization energy text box
- QM reorganization energy text box
- Update Plot button
- Property option menu and text box
- Plot buttons
- Legend option
- Plot area
- Refractive index tab
- Extinction coefficient tab
- Status bar
- Load from Workspace button
-
Load the data associated with the structure in the Workspace, which must be the output structure from a job run from the Optoelectronic Film Properties Panel.
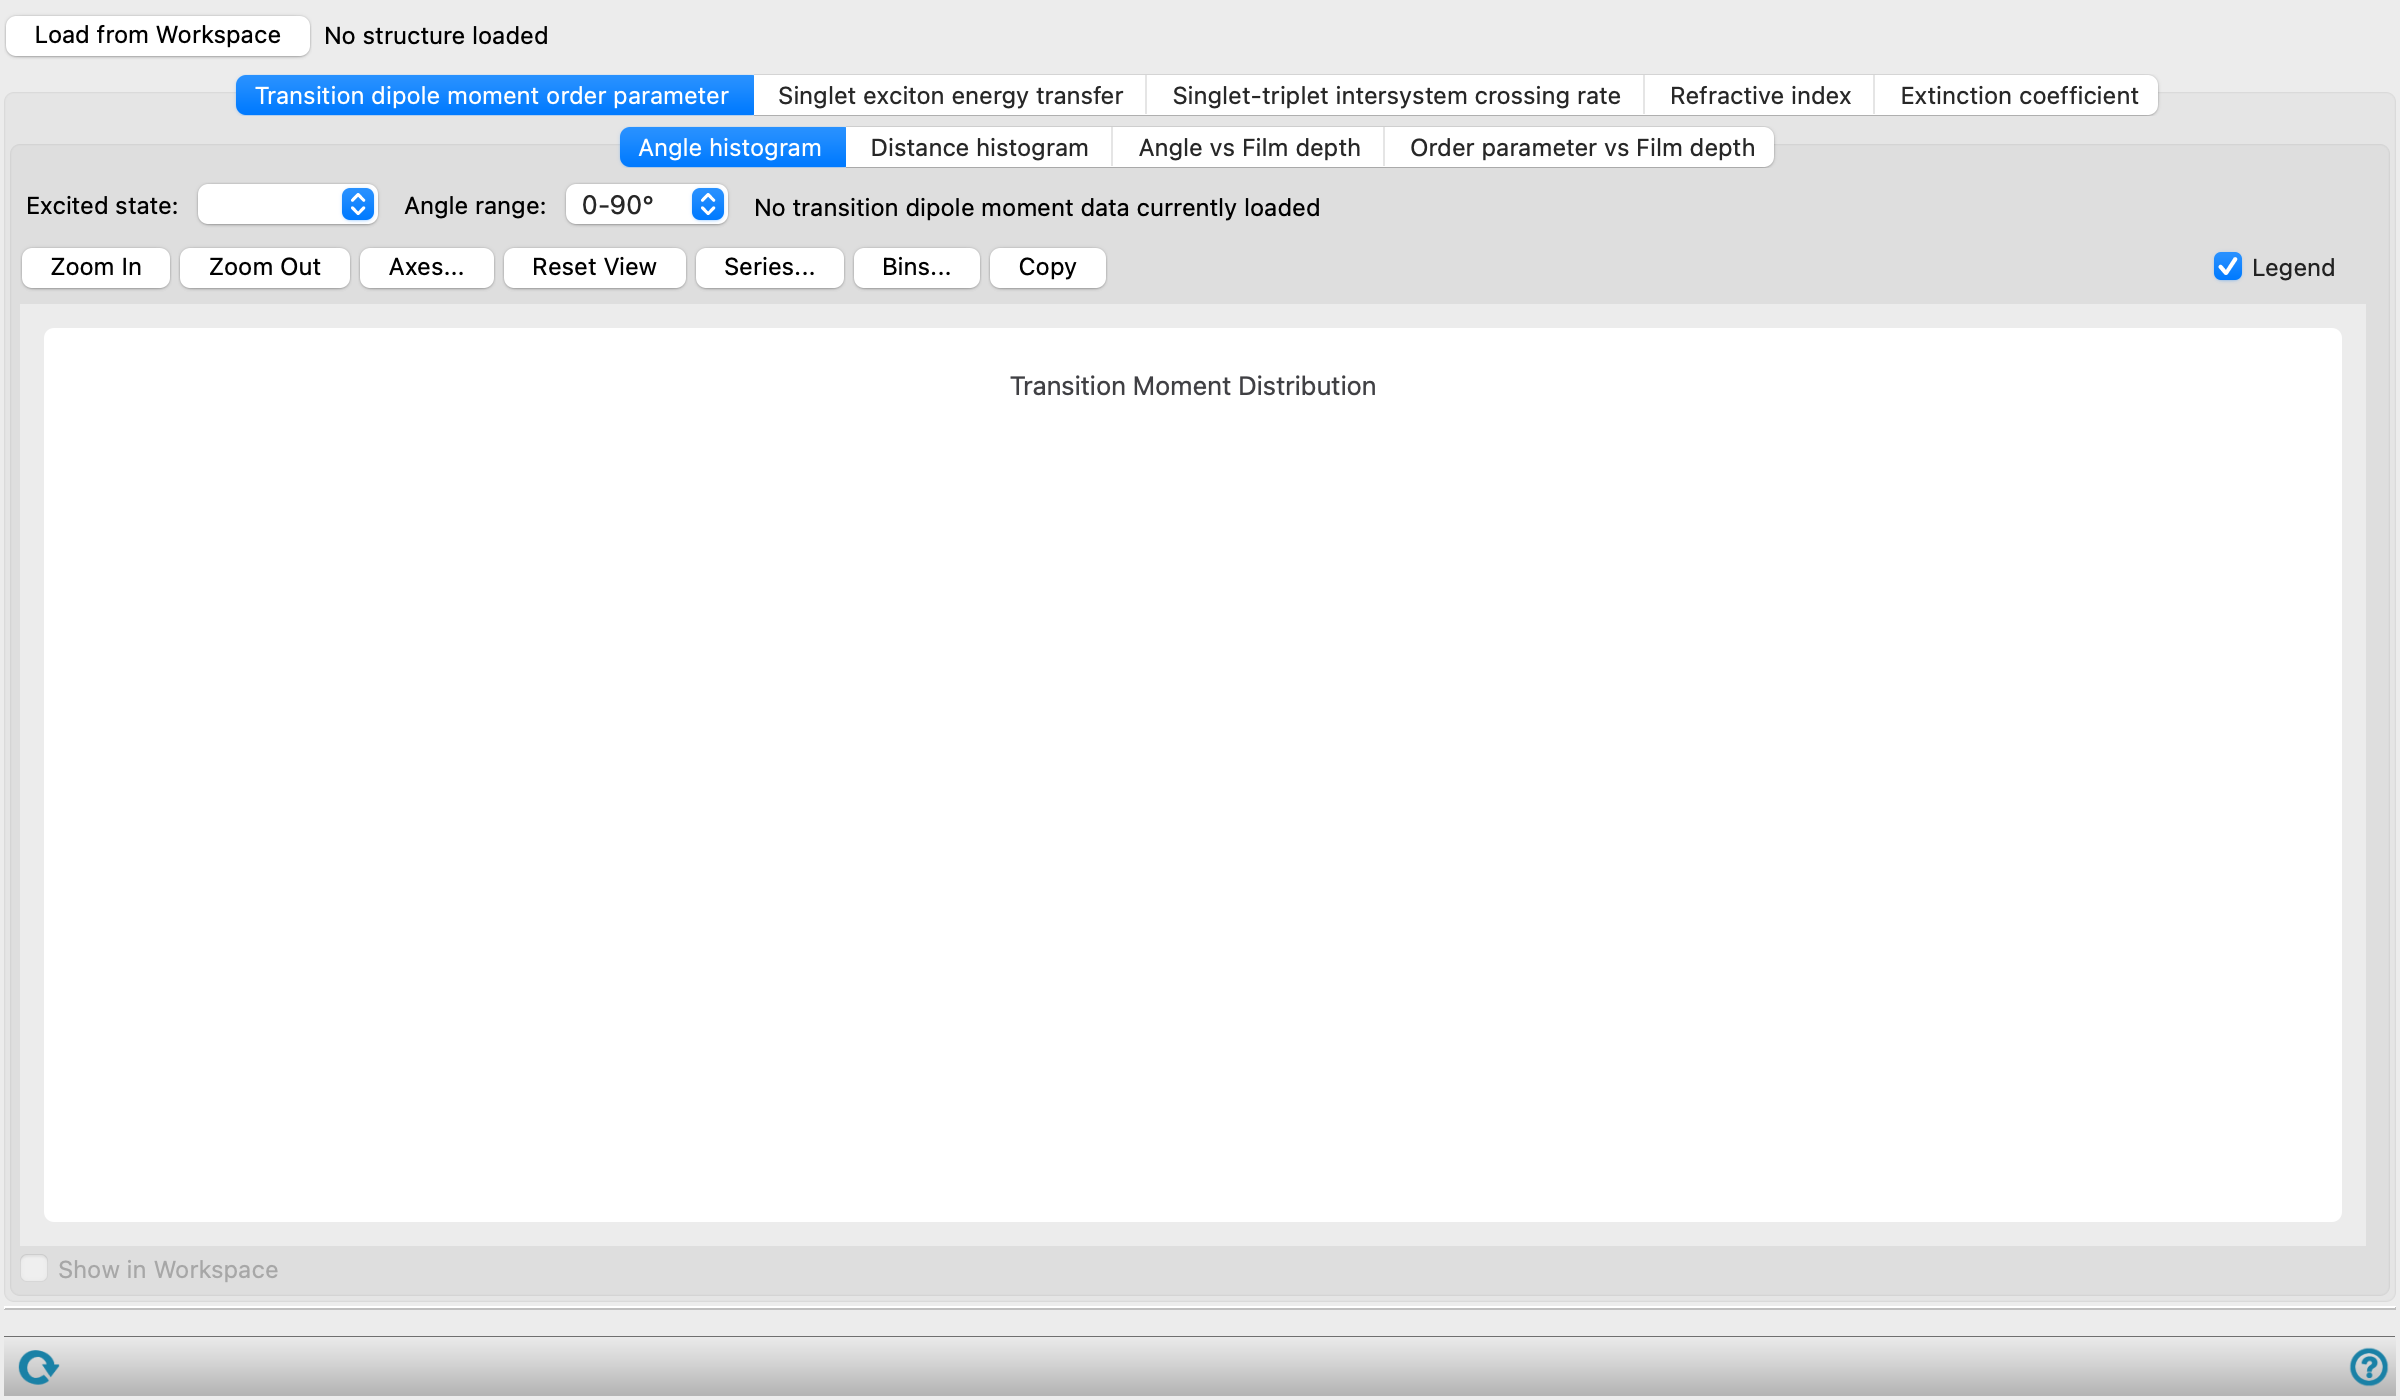
- Transition dipole moment order parameter tab
-
Plots data associated with the transition dipole moments. Displays data only if the transition dipole moment order parameter option was selected.
- Plot types tabs
-
-
Angle histogram—Displays a histogram of the frequency of transition dipole moments over an angle distribution.
-
Distance histogram—Displays a histogram of the frequency of molecules over the distance along the Z-axis.
-
Angle vs Film depth—Displays the plot of the angle, in degrees, against the distance along the Z-axis, in Angstrom.
-
Order parameter vs Film depth—Displays the plot of the order parameter against the distance along the Z-axis, in Angstrom.
-
- Excited state option menu
-
Plot the results from a transition moment order parameter calculation for the selected excited state.
- Angle range option menu
-
Specify the angles over which to plot the histogram. Only available for the Angle histogram plot type.
- Order parameter text
-
The Order parameter for the specified Excited state is displayed to the right. Only present for the Angle histogram plot type.
- Axis step size slider
-
Specify the step size along the Z-axis to plot. Only present for the Distance histogram, Angle vs Film depth, and Order parameter vs Film depth plot types.
- Plot buttons
-
Use these buttons to configure the plot.
- Zoom In—Zoom in on the plot. Each click zooms in by a predefined factor, enlarging the view of the current center of the plot. You can also zoom in on a particular area by dragging out a rectangle.
- Zoom Out—Zoom out by a predefined factor. Each click zooms out by a predefined factor, to show more of the plot.
- Axes—Set the range and labeling options for the axes. Opens the Axes Parameters Dialog Box.
- Reset View—Reset the view of the plot to the original zoom and pan values.
- Series—Set up the appearance of the plot series, such as color, symbol, lines. Opens the Series Parameters Dialog Box.
- Bins—Define the bins used for a histogram plot. Opens the Number of Bins Dialog Box.
- Copy—copy an image of the plot to the clipboard, for use in other applications.
- Legend option
-
Display a legend in the plot.
- Show in Workspace option
-
Show the transition dipole moments in the Workspace. The transition moments are shown as arrows that indicate the orientation of the transition. The arrow origin is the molecular center of mass. The location of the arrow does not provide any information about the location of the excited state, only the direction is meaningful. Arrows are green for moments that align within 45 degrees of the reference axis and blue otherwise.
-
Only present for the Angle histogram plot type.
- Singlet exciton energy transfer tab
-
Plots the singlet exciton energy transfer rate as a function of intermolecular distance. The data is averaged over 1 Å intervals. Displays data only if the singlet exciton energy transfer rate option was selected.
- Temperature text box
-
Specify the temperature to be used, in kelvin.
- Donor energy correction text box
-
Specify the correction to the donor S1 excitation energy in electron volts. The default value is 0 eV.
-
The correction value can be obtained from high-level calculations or experimental values which allows use of an inexpensive level of theory with high accuracy. This also allows for relaxation effects in the excited state (e.g. S1*-->S1) to be accounted for.
- Acceptor energy correction text box
-
Specify the correction to the acceptor S1 excitation energy in electronvolts. The default value is 0 eV.
-
The correction value can be obtained from high-level calculations or experimental values which allows use of an inexpensive level of theory with high accuracy. This also allows for relaxation effects in the excited state (e.g. S1*-->S1) to be accounted for.
- Reorganization energy text box
-
Specify the S1 reorganization energy. The default value is 0.1 eV.
-
The reorganization energy can be obtained from DFT calculations or literature values, see the Using section for more information.
- Update Plot button
-
Click to recalculate singlet exciton energy transfer rate using the Temperature, Donor energy correction, Acceptor energy correction, and Reorganization energy parameters defined here and update the plot accordingly.
- Singlet exciton energy transfer rate data text
-
Displays the log of the maximum singlet exciton energy transfer rate and its corresponding intermolecular distance. Noneditable.
- Plot toolbar
-
The toolbar has tools for manipulating the plot and for saving images. The buttons that are common to all plot toolbars are described in the Plot Toolbar topic.
- Plot area
-
This area displays the singlet exciton energy transfer rate in seconds-1 as a function of intermolecular distance in angstroms.
- Singlet-triplet intersystem crossing rate tab
-
Plots a histogram of the frequency of the selected property. Displays data only if the singlet-triplet intersystem crossing rate option was selected.
- Intersystem crossing rate data text
-
Displays Intersystem crossing rate data loaded if the corresponding option was selected in the Optoelectronic Film Properties Panel. When there is No intersystem crossing rate data currently loaded, the tab is empty. Noneditable.
- Singlet state option menu
-
Plot the results from a intersystem crossing rate calculation for the selected singlet state.
- Singlet state energy text box
-
The energy averaged over all molecules for the specified singlet state is displayed to the right of the option menu in eV. Noneditable.
- Triplet state option menu
-
Plot the results from a intersystem crossing rate calculation for the selected triplet state.
- Triplet state energy text box
-
The energy averaged over all molecules for the specified triplet state is displayed to the right of the option menu in eV. Noneditable.
- Temperature text box
-
Specify the temperature to be used, in kelvin.
- ISC reorganization energy text box
-
Specify the reorganization energy of the triplet with respect to the singlet used to calculate the ISC rate in electron volts.
- RISC reorganization energy text box
-
Specify the reorganization energy of the singlet with respect to the triplet used to calculate the RISC rate in electron volts.
- QM reorganization energy text box
-
Specify the quantum-mechanical contribution to the reorganization energy, which is the portion of the total reorganization energy associated with high-frequncy vibrational modes, which is used to calculate the Huang-Rhys parameters.
- Update Plot button
-
Click to recalculate intersystem crossing data using the Temperature, ISC reorganization energy, RISC reorganization energy, and QM reorganization energy parameters defined here and plot a histogram of the frequency of the selected property.
- Property option menu and text box
-
Select a property to plot the corresponding histogram and display its value averaged over all molecules. The properties available are:
- Marcus ISC
- Marcus RISC
- Marcus-Levich-Jortner ISC
- Marcus-Levich-Jortner RISC
- Singlet Energy
- Triplet Energy
- ΔE_ST
- Spin-Orbit Coupling
- ISC Reorganization Energy
- RISC Reorganization Energy
- Plot buttons
-
Use these buttons to configure the plot.
- Zoom In—Zoom in on the plot. Each click zooms in by a predefined factor, enlarging the view of the current center of the plot. You can also zoom in on a particular area by dragging out a rectangle.
- Zoom Out—Zoom out by a predefined factor. Each click zooms out by a predefined factor, to show more of the plot.
- Axes—Set the range and labeling options for the axes. Opens the Axes Parameters Dialog Box.
- Reset View—Reset the view of the plot to the original zoom and pan values.
- Series—Set up the appearance of the plot series, such as color, symbol, lines. Opens the Series Parameters Dialog Box.
- Bins—Define the bins used for a histogram plot. Opens the Number of Bins Dialog Box.
- Copy—copy an image of the plot to the clipboard, for use in other applications.
- Legend option
-
Display a legend in the plot.
- Plot area
-
The count is plotted against the selected property in this area
You can zoom in to an area by dragging out a rectangle.
- Refractive index tab
-
Plots the refractive index as a function of frequency in eV. The data is calculated over the range of frequencies as specified in the Optoelectronic Film Properties Panel. Displays data only if the refractive index option was selected.
- Refractive index data text
-
Displays Refractive index data loaded if the corresponding option was selected in the Optoelectronic Film Properties Panel. When there is No refractive index data currently loaded, the tab is empty. Noneditable.
- Refractive index axes section and text boxes
-
The vectors (i, j, and k) along which the refractive index is calculated expressed in the x, y, z basis. Noneditable.
- Show in Workspace option
-
Show the Refractive index axes in the Workspace.
- Plot toolbar
-
The toolbar has tools for manipulating the plot and for saving images. The buttons that are common to all plot toolbars are described in the Plot Toolbar topic.
- Plot types tabs
-
-
Refractive index ratio spectrum—Displays the refractive index as a function of frequency in electron volts.
-
Refractive index spectrum—Displays the refractive index ratio as a function of frequency in electron volts.
-
- Extinction coefficient tab
-
Displays the extinction coefficient calculation results as well as the following tabs: Oscillator strength histogram, Oscillator strength spectrum, and Extinction coefficient spectrum. Displays data only if the extinction coefficient option was selected.
- Extinction coefficient data text
-
Displays Extinction coefficient data loaded if the corresponding option was selected in the Optoelectronic Film Properties Panel. When there is No extinction coefficient data currently loaded, the tab is empty. Noneditable.
- Axes section and text boxes
-
The vectors (i, j, and k) along which the extinction coefficient is calculated expressed in the x, y, z basis. Noneditable.
- Show in Workspace option
-
Show the above axes in the Workspace.
- Oscillator strength histogram tab
-
Plots a histogram of the frequency of the selected property over molecules in the material. Displays data only if the extinction coefficient option was selected.
- Plot the species with SMILES option menu
-
Select the species to plot.
- Excited State option menu and text box
-
Plot the results from a extinction coefficient calculation for the selected excited state. The energy averaged over all molecules for the specified excited state is displayed to the right of the option menu in eV. Noneditable.
- Property option menu and text box
-
Select a property to plot the corresponding histogram and display its value averaged over all molecules. The properties available are:
- Transition Dipole Moment i
- Transition Dipole Moment j
- Transition Dipole Moment k
- Transition Dipole Moment
- Oscillator Strength i
- Oscillator Strength j
- Oscillator Strength k
- Oscillator Strength
- Energy
- Plot buttons
-
Use these buttons to configure the plot.
- Zoom In—Zoom in on the plot. Each click zooms in by a predefined factor, enlarging the view of the current center of the plot. You can also zoom in on a particular area by dragging out a rectangle.
- Zoom Out—Zoom out by a predefined factor. Each click zooms out by a predefined factor, to show more of the plot.
- Axes—Set the range and labeling options for the axes. Opens the Axes Parameters Dialog Box.
- Reset View—Reset the view of the plot to the original zoom and pan values.
- Series—Set up the appearance of the plot series, such as color, symbol, lines. Opens the Series Parameters Dialog Box.
- Bins—Define the bins used for a histogram plot. Opens the Number of Bins Dialog Box.
- Copy—copy an image of the plot to the clipboard, for use in other applications.
- Legend option
-
Display a legend in the plot.
- Plot area
-
The count is plotted against the selected property in this area
You can zoom in to an area by dragging out a rectangle.
- Oscillator strength spectrum tab
-
Plots the oscillator strength, or absorption spectrum, of the material as a function of excitation energy in cm-1. Displays data only if the extinction coefficient option was selected.
- Plot toolbar
-
The toolbar has tools for manipulating the plot and for saving images. The buttons that are common to all plot toolbars are described in the Plot Toolbar topic.
- Plot area
-
This area displays the oscillator strength as a function of excitation energy in cm-1.
- Open Spectrum Plot button
-
Open this plot in the Spectrum Plot Panel for further analysis and finer control of the plotting.
- Extinction coefficient spectrum tab
-
Plots the extinction coefficient as a function of excitation energy in cm-1 for the selected species. Displays data only if the extinction coefficient option was selected.
- Plot the species with SMILES option menu
-
Select the species to plot the extinction coefficient spectrum for.
- Plot toolbar
-
The toolbar has tools for manipulating the plot and for saving images. The buttons that are common to all plot toolbars are described in the Plot Toolbar topic.
- Plot area
-
This area displays the extinction coefficient as a function of excitation energy in cm-1.
- Open Spectrum Plot button
-
Open this plot in the Spectrum Plot Panel for further analysis and finer control of the plotting.
- Status bar
-
The status bar displays information about the current job settings and status for the panel. The settings includes the job name, task name and task settings (if any), number of subjobs (if any) and the host name and job incorporation setting. The job status can include messages about job start, job completion and incorporation.
Use the Reset button
 to reset the panel to its default settings and clear any data from the panel.
 The status bar also contains the Help button
 , which opens the help topic for the panel in your browser. If the panel is used by one or more tutorials, hovering over the Help button displays a
  button, which you can click to display a list of tutorials (or you can right-click the Help button instead). Choosing a tutorial opens the tutorial topic.