Order Parameter Analysis Results Viewer Panel
Plot the results of an order parameter analysis.
To open this panel: click the Tasks button and browse to Materials → Classical Mechanics → Trajectory Analysis → Order Parameter Results.
To open this panel from the entry group for the results of an order parameter job .
.
The following licenses are required to use this panel: MS Maestro
- Features
- Additional Resources
Order Parameter Analysis Results Viewer Panel Features
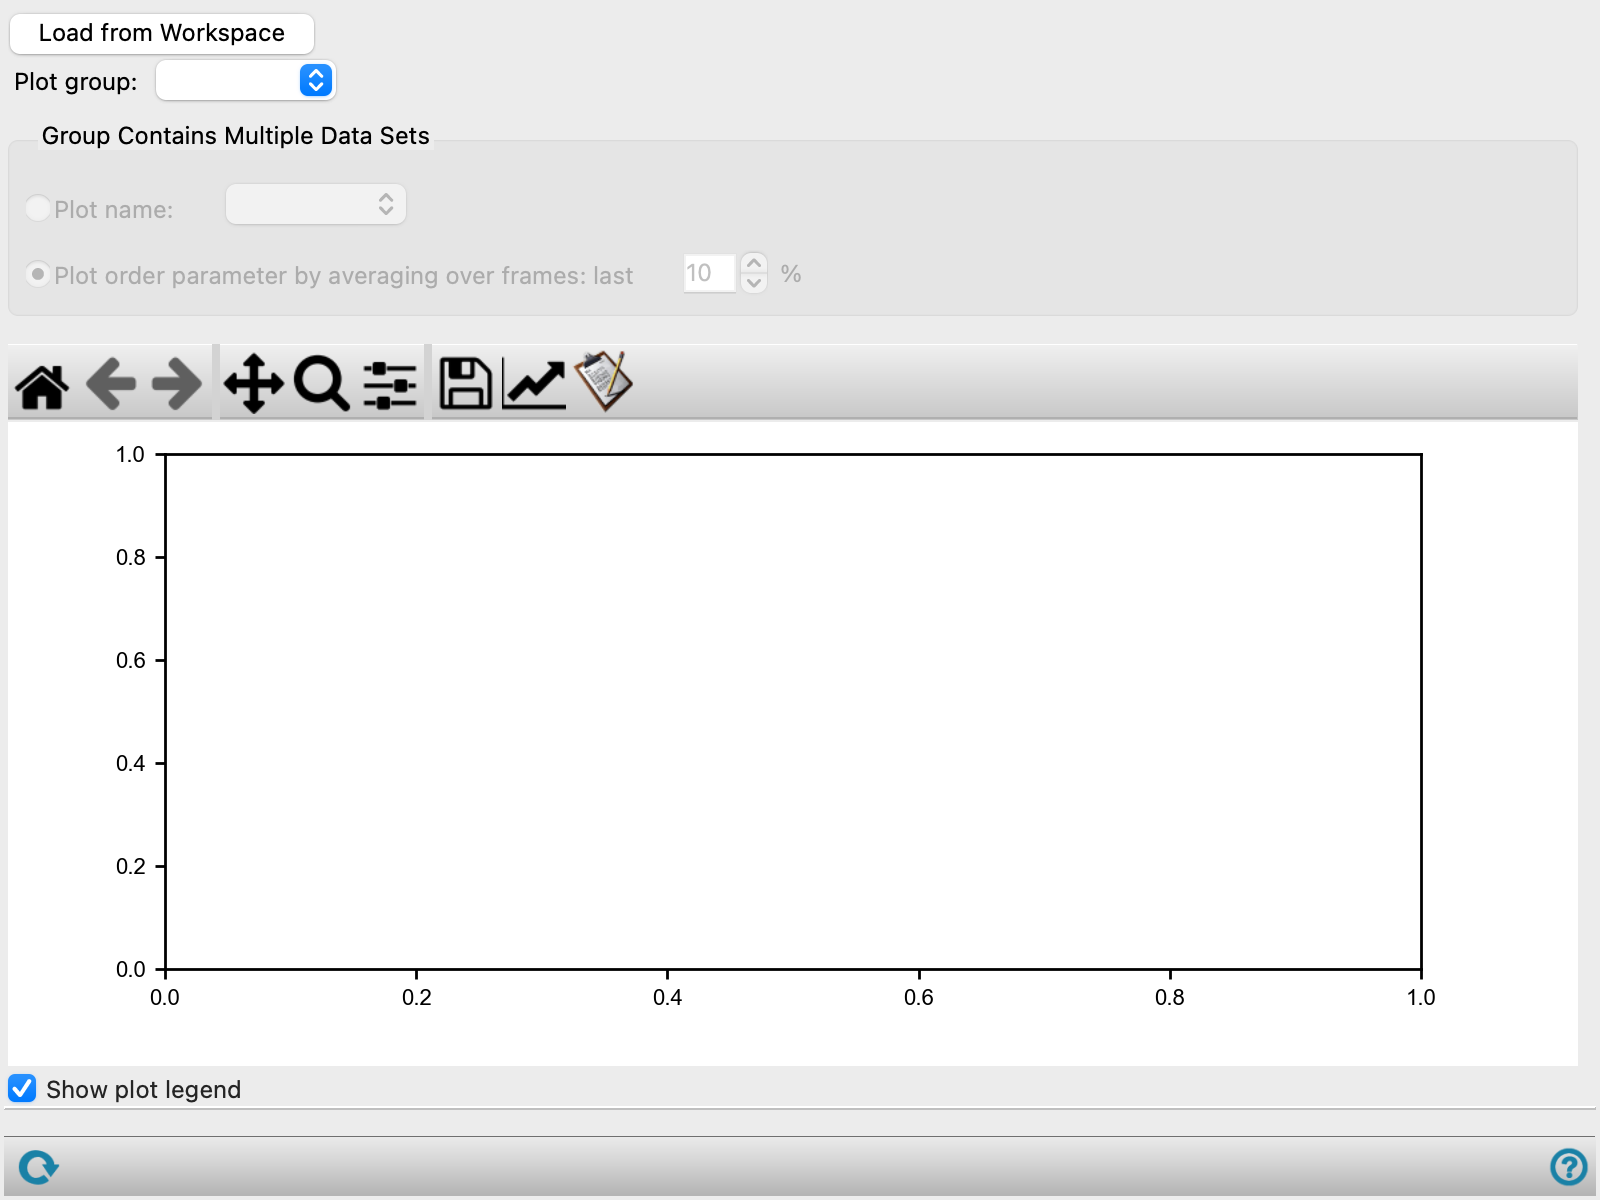
- Load from Workspace button
-
Load the results of an order parameter calculation from the Workspace entry. If there is no entry in the Workspace, open a file selector so you can choose the CSV file that contains the results of the order parameter calculation.
- Plot group option menu
-
Choose the descriptor group to plot. The group labels are the ones defined in the Group text box of the descriptor definition controls in the Perform Order Parameter Analysis Panel.
- Plot name option and menu
-
Plot the order parameter as a function of simulation time for the selected descriptor. The descriptor names are the ones defined in the Name text box of the descriptor definition controls in the Perform Order Parameter Analysis Panel.
- Plot order parameter by averaging over frames option and menu
-
Average the order parameter for each descriptor in the group over the specified percentage of frames, taken from the end of the trajectory, and plot the average parameter against the descriptor name. This is useful if, for example, the descriptors define a set of structures such as the components of a mixture or molecules of increasing size.
- Only for molecule # option and menu
-
Plot the order parameter of an individual molecule. The menu displays the molecule number of all the molecules that were specified for analysis in the Perform Order Parameter Analysis Panel. To highlight the corresponding molecule in the Workspace, use the Atom Selection Dialog Box and select by Molecule number in the Molecule tab.
- Plot toolbar
-
The toolbar has tools for manipulating the plot and for saving images. The buttons that are common to all plot toolbars are described in the Plot Toolbar topic.
- Plot area
-
Displays the plot of the order parameter as a function of simulation time or the average order parameter against descriptor identity.
- Show plot legend option
-
Show the legend for the plot. You can move the legend by dragging it to a new location.
- Status bar
-
The status bar displays information about the current job settings and status for the panel. The settings includes the job name, task name and task settings (if any), number of subjobs (if any) and the host name and job incorporation setting. The job status can include messages about job start, job completion and incorporation.
Use the Reset button
 to reset the panel to its default settings and clear any data from the panel.
 The status bar also contains the Help button
 , which opens the help topic for the panel in your browser. If the panel is used by one or more tutorials, hovering over the Help button displays a
  button, which you can click to display a list of tutorials (or you can right-click the Help button instead). Choosing a tutorial opens the tutorial topic.