Phonon Density of States Viewer Panel
Plot the phonon density of states from a periodic DFT calculation as a function of frequency. Also display the dielectric constant tensors. For the calculation, you must select Γ-point phonons in the Quantum ESPRESSO Calculations Panel as a property to generate.
To open this panel: click the Tasks button and browse to Materials → Quantum Mechanics → Quantum ESPRESSO → Phonon Density of States Viewer.
To open this panel from the entry group for the results of a Quantum ESPRESSO job .
.
The following licenses are required to use this panel: MS Maestro, Quantum Espresso Interface
- Features
- Additional Resources
Phonon Density of States Viewer Panel Features
- View results from option menu
- Import button
- Browse button
- Open New Viewer button
- Open Viewers for Selected Entries button
- Positive frequency cutoff text box
- Harmonic threshold text box
- Set cutoff button
- Plot tab
- Dielectric constant tab
- Status bar
- View results from option menu
-
Choose the structure source for displaying the phonon density of states and dielectric constant tensors.
- Workspace (included entry)—Use the entry that is currently included in the Workspace. Only one entry must be included in the Workspace. When this option is selected, the Import button is displayed.
- File—Use the specified file. When this option is selected, the Browse button is displayed.
- Import button
-
Click Import to load the included entry from the Workspace into the viewer. The name of the included entry is displayed to the right of the button.
- Browse button
-
Click Browse and navigate to the file
- Open New Viewer button
-
Open a new viewer so you can display a different phonon density of states plot.
- Open Viewer for Selected Entries button
-
Select entries in the Entry List or Project Table, then click this button to open a viewer for each entry. This allows you to view plots for related structures and data.
- Positive frequency cutoff text box
-
Specify the frequency cutoff, in cm-1, where any frequencies below this value will not be considered.
- Harmonic threshold text box
-
Specify the harmonic threshold, in cm-1, where any frequencies below this value will be set to this value.
- Set cutoff button
-
Click to set the frequency restrictions placed via the Positive frequency cutoff and Harmonic threshold. The information button to the right displays all the frequencies (both positive and negative) and the frequencies after applying the cutoffs.
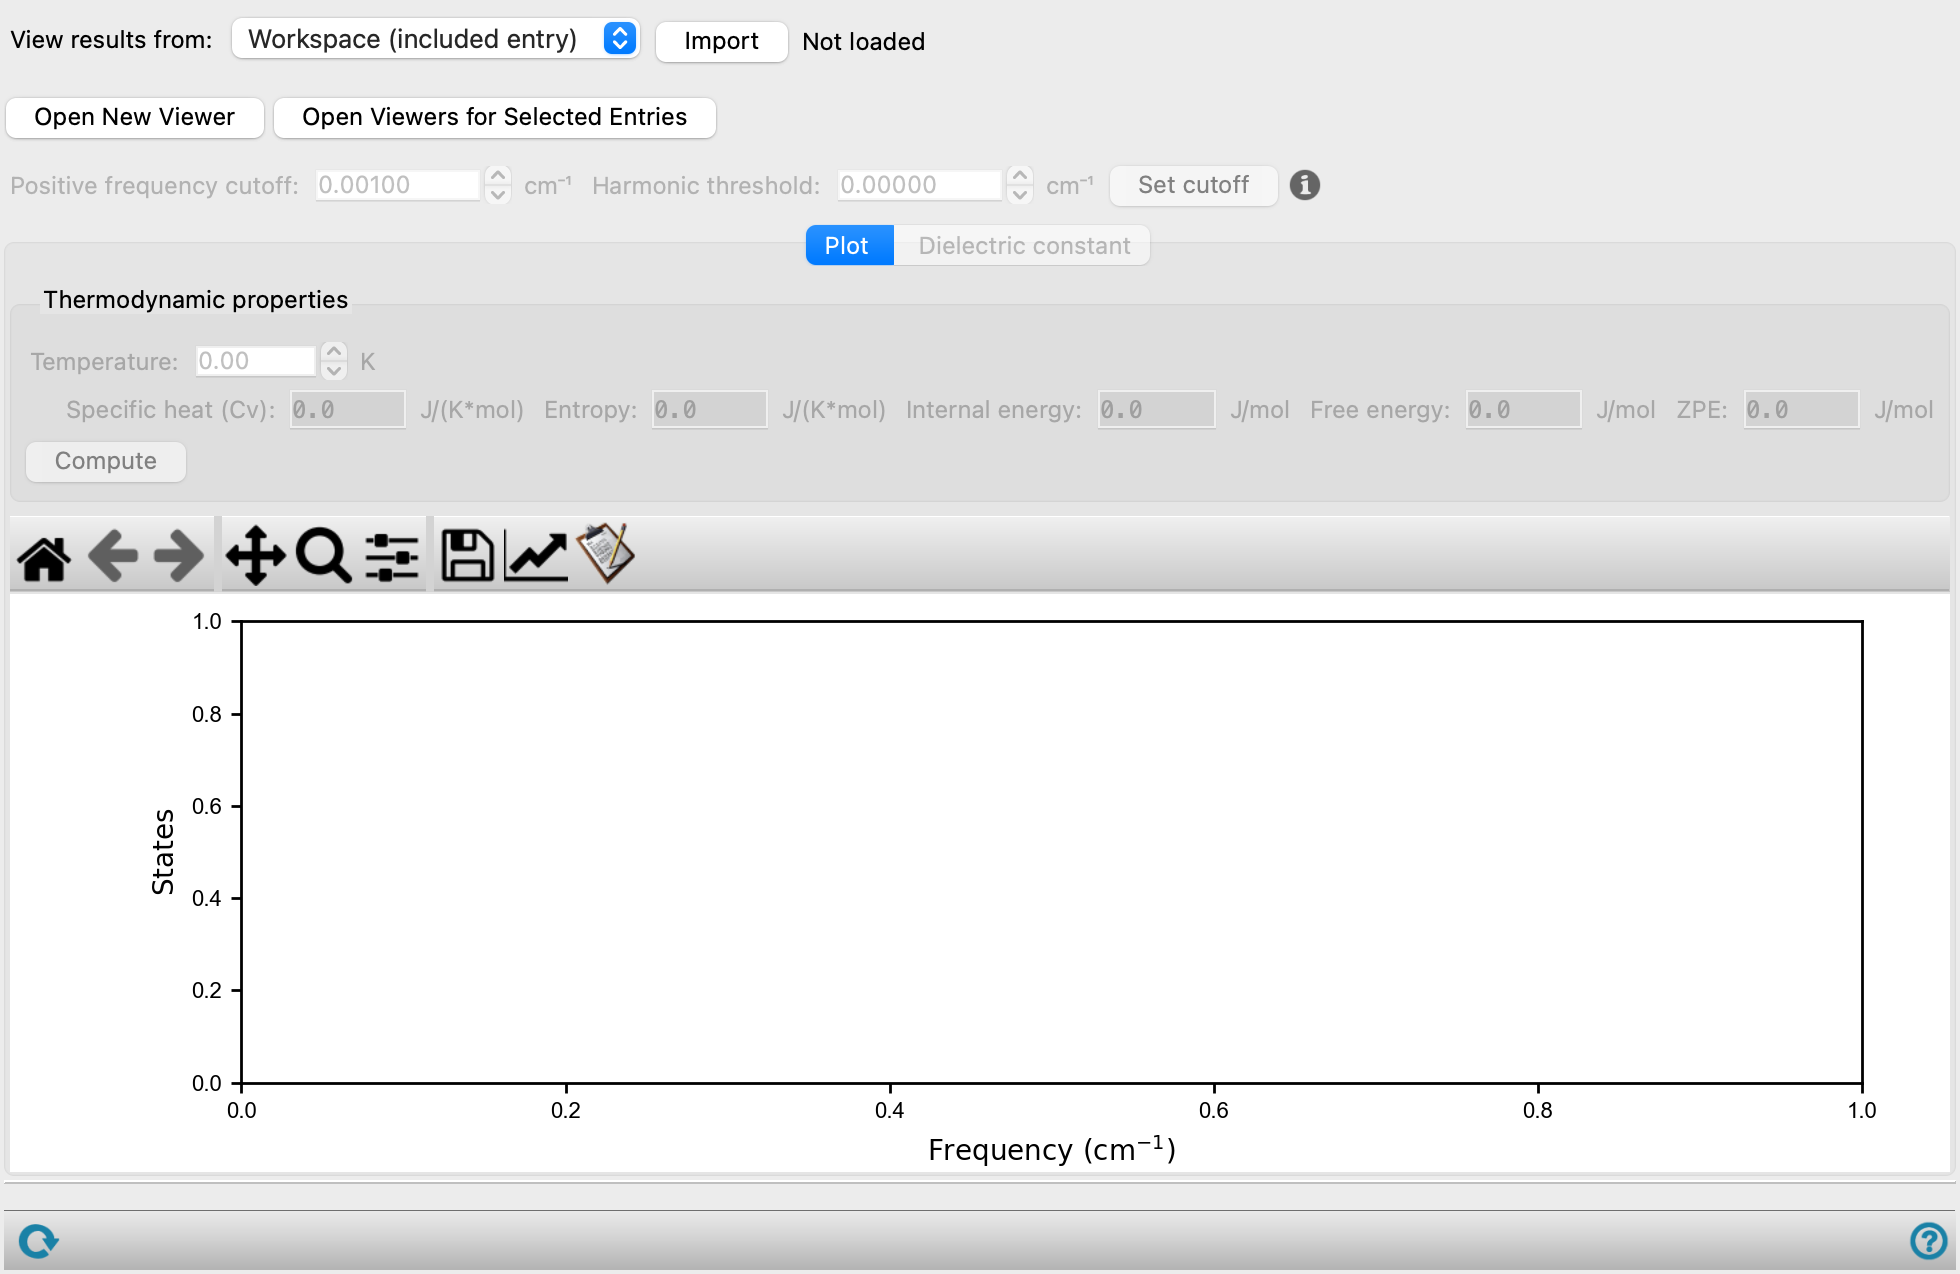
- Plot tab
-
- Thermodynamic properties section
-
Calculate and display thermodynamic properties at a given temperature.
- Temperature text box
-
Set the temperature for the calculation of thermodynamic properties.
- Property text boxes
-
These noneditable text boxes display the various thermodynamic properties at the chosen temperature.
- Specific heat (Cv)
- Entropy
- Internal energy
- Free energy
- ZPE (zero-point energy)
- Compute button
-
Compute the thermodynamic properties after changing the temperature.
- Plot toolbar
-
The toolbar has tools for manipulating the plot and for saving images. The buttons that are common to all plot toolbars are described in the Plot Toolbar topic.
- Plot area
-
This area displays the phonon density of states as a function of frequency (in cm-1).
- Dielectric constant tab
-
Display the dielectric constant tensors. Only available if fixed occupations were used (see Quantum ESPRESSO Calculations - Advanced Options Dialog Box).
- Static dielectric tensor section
-
- Electronic table
-
Displays the components of the electronic tensor. This is the high frequency, ion-clamped dielectric constant. This tensor does not depend on vibrations. Noneditable.
- Ionic table
-
Displays the components of the ionic tensor. This tensor depends on vibrations. Noneditable.
- Electronic + ionic dielectric tensor table
-
Displays the components of the total dielectric constant tensor taking into account the electronic and ionic tensors. Noneditable.
- Isotropic part text box
-
Displays the isotropic part of the given tensor. Noneditable.
- Individual phonon contributions to the static dielectric tensor section
-
Display the dielectric constant tensors for the selected vibrations.
- Ionic table
-
Displays the components of the ionic tensor for the vibrations selected in the individual phonon contributions table. Noneditable.
- Electronic + ionic dielectric tensor table
-
Displays the components of the total dielectric constant tensor for the vibrations selected in the individual phonon contributions table. The electronic tensor used to calculate the total is shown in the static dielectric tensor section. Noneditable.
- Isotropic part text box
-
Displays the isotropic part of the given tensor. Noneditable.
- Individual phonon contributions table
-
The vibrations calculated as a part of the phonon calculation are listed here along with the following corresponding properties:
-
Index—The index assigned to a given vibration. Noneditable.
-
Frequency, 1/cm— The frequency of the vibration in cm-1. Noneditable.
-
Ionic isotropic fraction—The fractional ionic isotropy of the vibration. Noneditable.
-
Ionic anisotropy—The value of ionic anisotropy and its corresponding axis. Noneditable.
-
- Total ionic isotropic fraction text box
-
Displays the fractional total of ionic isotropy for the selected vibrations. The total for all listed vibrations is 1. Noneditable.
- Status bar
-
The status bar displays information about the current job settings and status for the panel. The settings includes the job name, task name and task settings (if any), number of subjobs (if any) and the host name and job incorporation setting. The job status can include messages about job start, job completion and incorporation.
Use the Reset button
 to reset the panel to its default settings and clear any data from the panel.
 The status bar also contains the Help button
 , which opens the help topic for the panel in your browser. If the panel is used by one or more tutorials, hovering over the Help button displays a
  button, which you can click to display a list of tutorials (or you can right-click the Help button instead). Choosing a tutorial opens the tutorial topic.