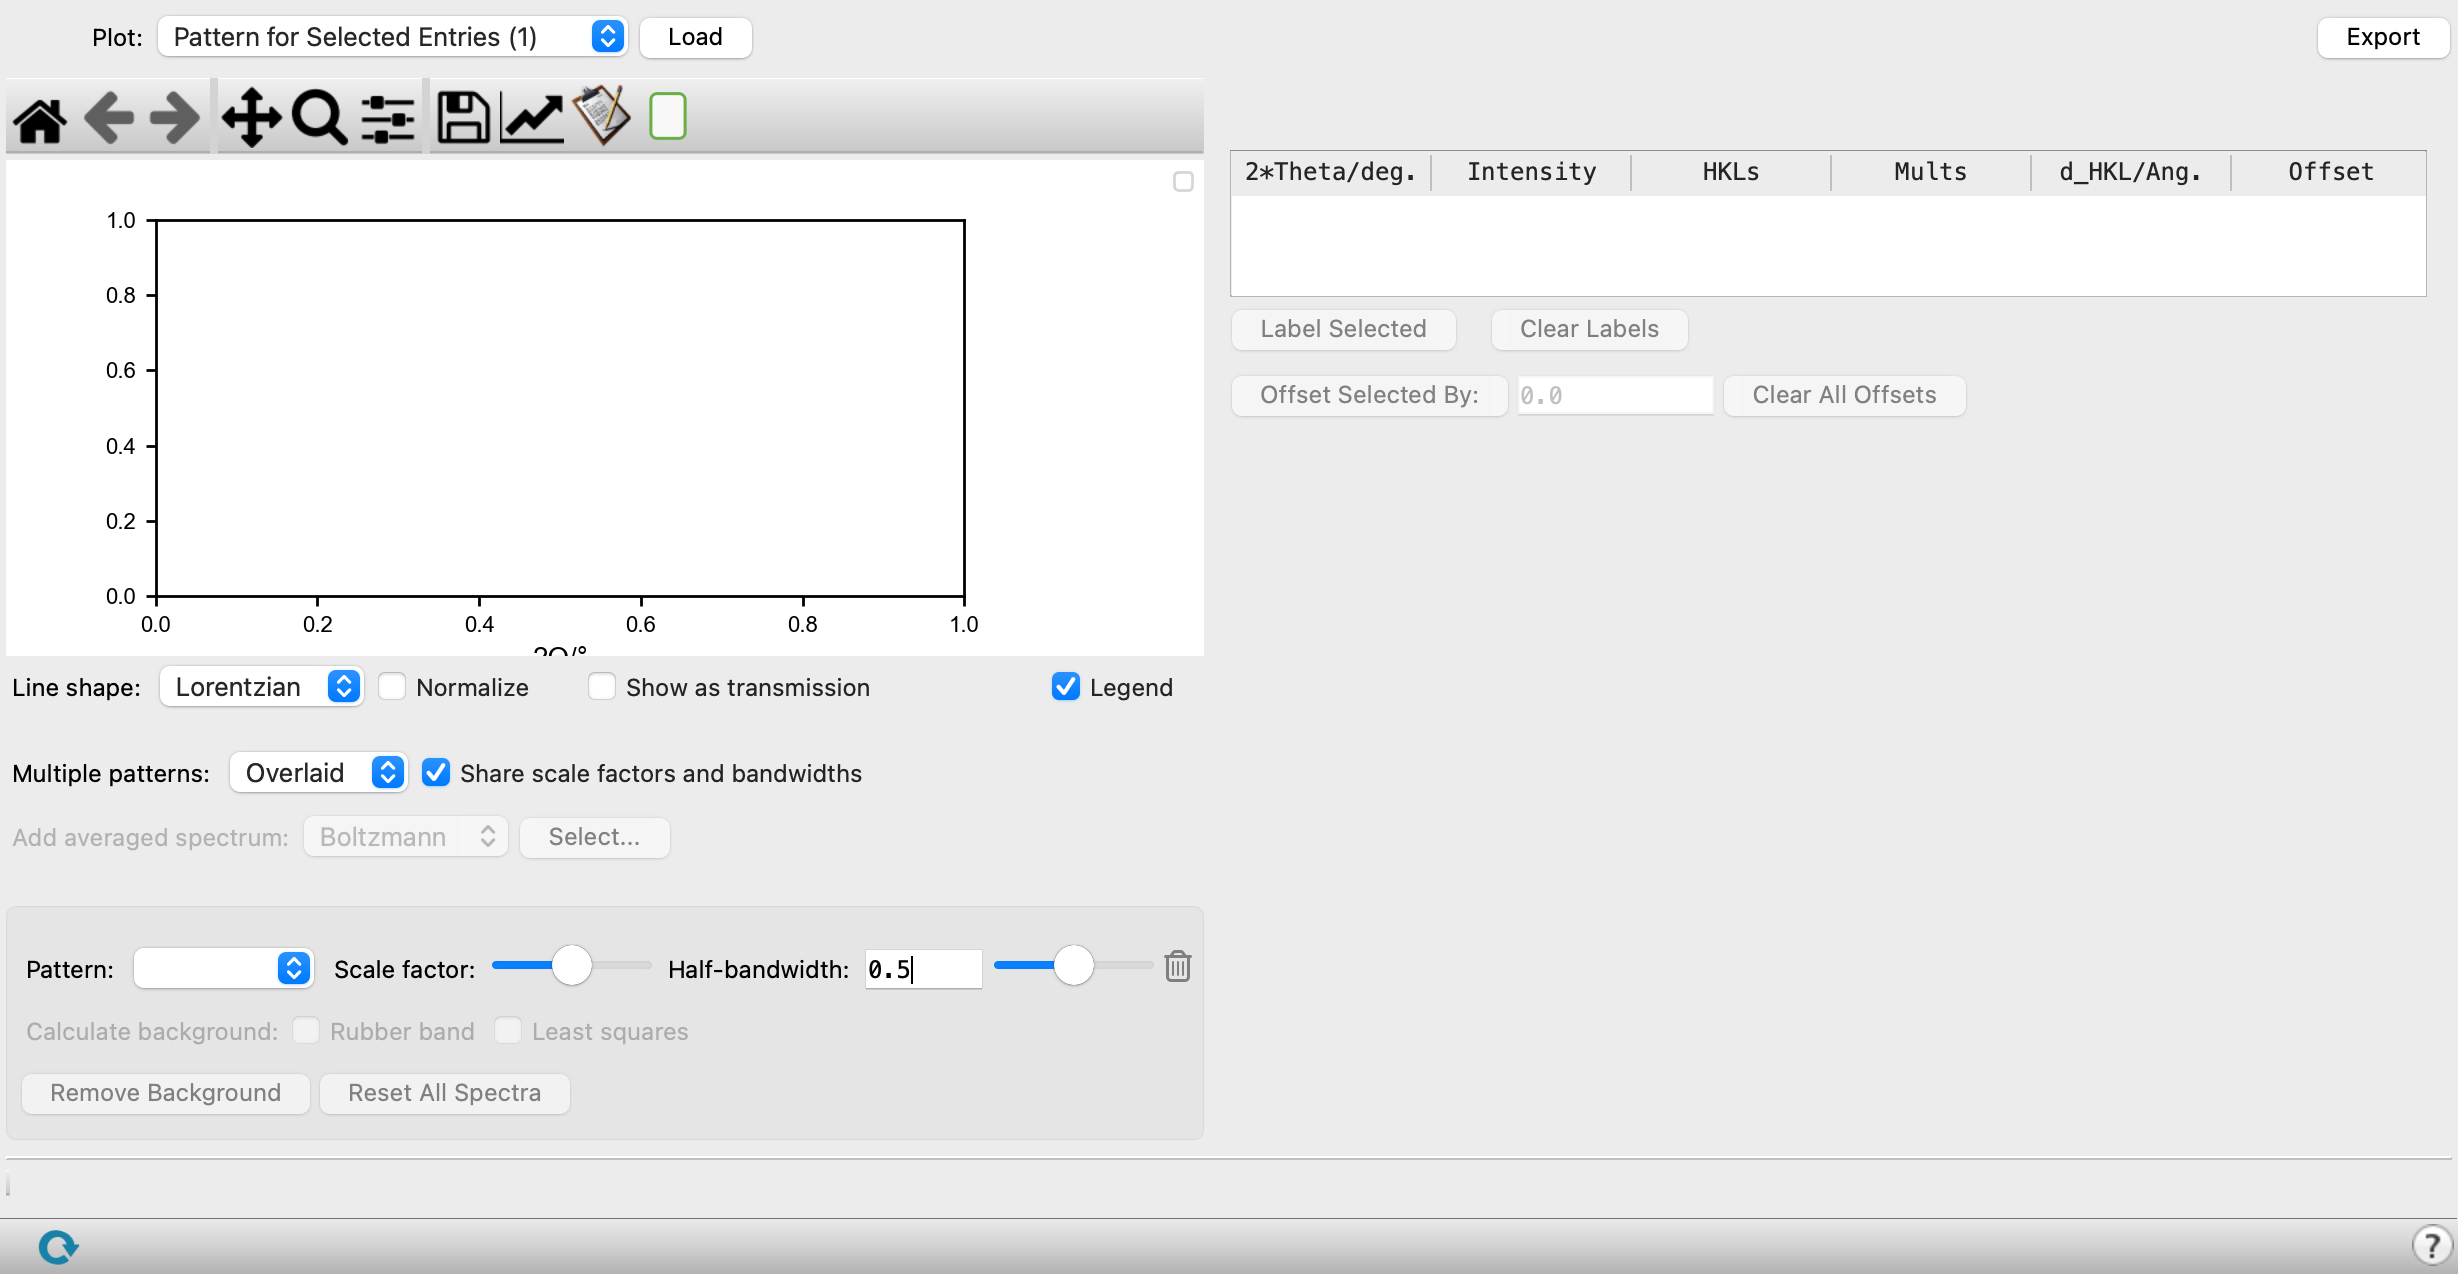
Powder Diffraction Pattern Plot Panel
Plot powder diffraction pattern intensity as a function of scattering angle.
To open this panel: click the Tasks button and browse to Materials → Tools → Powder Diffraction Pattern Results.
To open this panel from the entry group for the results of a powder diffraction pattern job .
.
The following licenses are required to use this panel: MS Maestro
- Features
- Additional Resources
Powder Diffraction Pattern Plot Panel Features
- Plot option menu
- Plot toolbar
- Plot area
- Line shape option menu
- Normalize option
- Show as transmission option
- Legend option
- Multiple patterns option menu
- Share scale factors and bandwidths option
- Add averaged spectrum option menu and Select button
- Pattern option menu
- Scale factor text box and slider
- Half-bandwidth text box and slider
- Remove button
- Calculate background options
- Remove Background button
- Reset All Spectra button
- Peak table
- Export Data button
- Plot option menu and Browse/Load buttons
-
Choose the source of the spectra to be plotted. You might want to plot multiple diffraction patterns to compare different phases or different patterns from a congeneric series, or see how temperature and other options change the pattern.
-
Pattern for Selected Entries (N)—plot the diffraction patterns for the N entries that are selected in the Project Table. A Load button is displayed to the right of the menu to load the spectra for plotting.
-
Pattern for Workspace Entries (N—plot diffraction patterns for the N entries that are included in the Workspace. A Load button is displayed to the right of the menu to load the spectra for plotting.
-
Other Theoretical Pattern—Read a theoretical (predicted) diffraction pattern from a pdp.spm file. A Browse button is displayed to the right of the menu. Any Boltzmann properties in the Project Table of the loaded pattern is used for Boltzmann averaging. If no Boltzmann properties exist as entries in the Project Table, the
-out.maefile in the directory is read to fetch these properties. -
Other Experimental Pattern—Read an experimental diffraction pattern from a file. A Browse button is displayed to the right of the menu. The file can use the extensions .txt, .csv, and .prn, and the data can be separated by spaces, tabs, or commas.
-
- Plot toolbar
-
The toolbar has tools for manipulating the plot and for saving images. The buttons that are common to all plot toolbars are described in the Plot Toolbar topic.
- Plot area
-
This area displays the diffraction patterns. You can use the toolbar to change the overall positioning and zoom level.
- Line shape option menu
-
Choose the line shape used for the diffraction pattern. The available shapes are Lorentzian and Gaussian.
- Normalize option
-
Scale the intensities so that the maximum absolute value of the displayed intensity is 1. The maximum value of the input intensity is reported in the legend.
- Show as transmission option
-
Display transmission intensity instead of absorption intensity on the y-axis.
- Legend option
-
Select this option to display a legend for the diffraction patterns in the top right corner of the plot area. The legend displays the entry title and entry ID. You can drag the legend anywhere in the plot area.
- Multiple patterns option menu
-
Choose how to display multiple diffraction patterns.
- Overlaid—The diffraction patterns are plotted on top of each other on the same plot. There is only one Y axis.
- Stacked—Each diffraction pattern is plotted separately (with its own Y axis), in a vertical stack. Zooming and panning works on all diffraction patterns simultaneously.
- Share scale factors and bandwidths option
-
This option links the scale factors and band widths for all the diffraction patterns. Deselect it if you want to make changes to individual diffraction patterns.
- Add averaged spectrum option menu and Select button
-
Add an average of all the calculated spectra to the plot. Choose how the spectrum should be averaged, then press
Selectto open a dialog box. Choose which spectra to average, name the averaged spectrum with the New spectrum prefix text box, and select Add to add the averaged spectrum to the plot.If Arithmetic is selected, you can apply weights to the spectrum by adding a “spectrum weight” property to the Project Table, and selecting the Add Weights option in the dialog box.
If Boltzmann averaging is selected, actual Boltzmann averaging is performed. Boltzmann averaging can only be applied to spectra with a Boltzmann property (
r_j_Boltzmann_weight,r_j_Total_Free_Energy_(au)_298.15K_1.00E+00atm,r_j_Final_energy) in the Project Table. - Pattern option menu
-
Choose a diffraction pattern to make changes to its parameters or perform other actions.
- Scale factor text box and slider
-
Scale the scattering angles of the diffraction patterns by the specified factor.
- Half-bandwidth text box and slider
-
Specify the half-bandwidth (related to full width at half maximum) for the diffraction pattern peaks.
- Remove button
-
Remove the spectrum from the plot area.
- Calculate background options
-
Calculate the background for the selected pattern using one or both of these methods:
- Least squares—the most generally useful method.
- Rubber band—useful when there is a rising background at low 2Θ values; uses a convex hull.
When you choose the Least squares method, settings can be made with the following tools:
- Smoothness text box
-
Controls the window over which the smoothing is done and hence the smoothness of the background curve. Decrease this value if the background has more structure. Only available for the Least squares method.
- Y-shift factor text box
-
Scaling value for intensity values to produce a smooth curve. Increasing this value introduces more of the intensity into the smoothing. Only available for the Least squares method.
- Remove Background button
-
Remove the background from the data for the selected pattern.
- Reset All Spectra button
-
Reset all spectra to the original data and clear all background fits.
- Peak table
-
This table lists the scattering angle, intensity, HKL values, and other properties of the peaks in the diffraction pattern that is selected from the Diffraction pattern option menu. The Offset column allows you to shift individual peaks, by editing the value in this column. The plot is recalculated after changing the offset. You can select multiple table rows with shift-click and control-click.
- Label Selected button
-
Label the peaks that are selected in the table with the ? value.
- Clear Labels button
-
Remove the labels from the spectrum.
- Offset Selected By button and text box
-
Offset the selected lines in the table by the amount given in the text box. This allows you to quickly apply an offset to multiple lines. The spectrum is recalculated when the offset is applied.
- Clear All Offsets button
-
Set all offset values to zero.
- Export Data button
-
Export the diffraction pattern plot data to a CSV file.