SiteMap Calibration
SiteMap Calibration
To calibrate and characterize the SiteMap properties, SiteMap has been applied to an extensive set of 230 proteins, which were taken either from the Glide database-enrichment suite or from the PDBbind database [6]. These proteins bind ligands of molecular weight at least 150 with affinities of at least 100 μ M. Of the 230 proteins, 155 have binding affinities of 1 μ M or less. The proteins were prepared using standard Schrödinger techniques. To avoid prejudicing the search, all crystallographic water was removed.
The entire data set was used to optimize the contributions to the overall SiteScore of the SiteMap properties described in How SiteMap Evaluates Sites. The criterion for the optimization was that the site with the best SiteScore corresponded to the co-crystallized site as often as possible. The tight-binding set was further used to calibrate SiteScore and its contact, phobic, and philic components so that the average value for each of these quantities is 1.0. The most significant terms are the size of the site as measured by the number of site points, the relative openness of the site as measured by the exposure and enclosure properties, and the tightness of the site as measured by the contact property. The phobicity of the site plays a smaller role, and the site philicity plays a small enough role that it could have been excluded.
Table 1 summarizes SiteMap’s accuracy in locating the primary (co-crystallized) binding site for the 230 proteins and for the 155 submicromolar binders. As Nayal and Honig [1] find for Screen and report for other methods, size is a fairly good predictor of the ligand-binding site. However, SiteScore is a better predictor, correctly locating the primary binding site in 96.5% of the proteins in the full set and 98.1% in the tight-binding set.
SiteMap can also be employed as a “classifier” to discriminate sites that bind ligands from sites that don’t. The objective is to determine whether a protein is likely to bind ligands tightly, not to decide which site in the protein to target. SiteMap can be used in this way by setting a threshold SiteScore value for recognition as a drug-binding site of 0.80 (80% of the average found for the 155 submicromolar sites). Used as a classifier, SiteMap performs as shown in Table 2. Similar results for the percentage of primary binding sites correctly classified (true positives) were reported for a different set of proteins by Nayal and Honig [1].
For a more recent and more extensive set of tests, see Ref. 8.
SiteMap Benchmark
The PDBbind v2020 dataset was used to benchmark SiteMap. From the SiteMap results of the site detection mode run, we determined that a site is liganded if the site center is within 4 Å of any ligand atoms. We first evaluate the performance of SiteMap on site detection by checking if the top 5 returned sites contain one site that is liganded based on the DCC criterion. Shown in Table 2, SiteMap was able to identify the liganded site in over 92% of PDBs with small molecule ligands, and the performance dropped as the ligand size increased. This is expected as the default SiteMap configurations are tuned towards identifying well defined small molecule ligand binding sites and may not effectively capture the protein-peptide or protein-protein interfaces.
|
Ligand Type |
total # PDB |
# PDB with liganded sites |
Percentage of PDBs where SiteMap identified a liganded site in top 5 |
| Small molecule | 17098 | 15784 | 92.3% |
| Macrocycle | 669 | 544 | 81.3% |
| Peptide | 2008 | 1277 | 63.6% |
| Protein | 2357 | 641 | 27.2% |
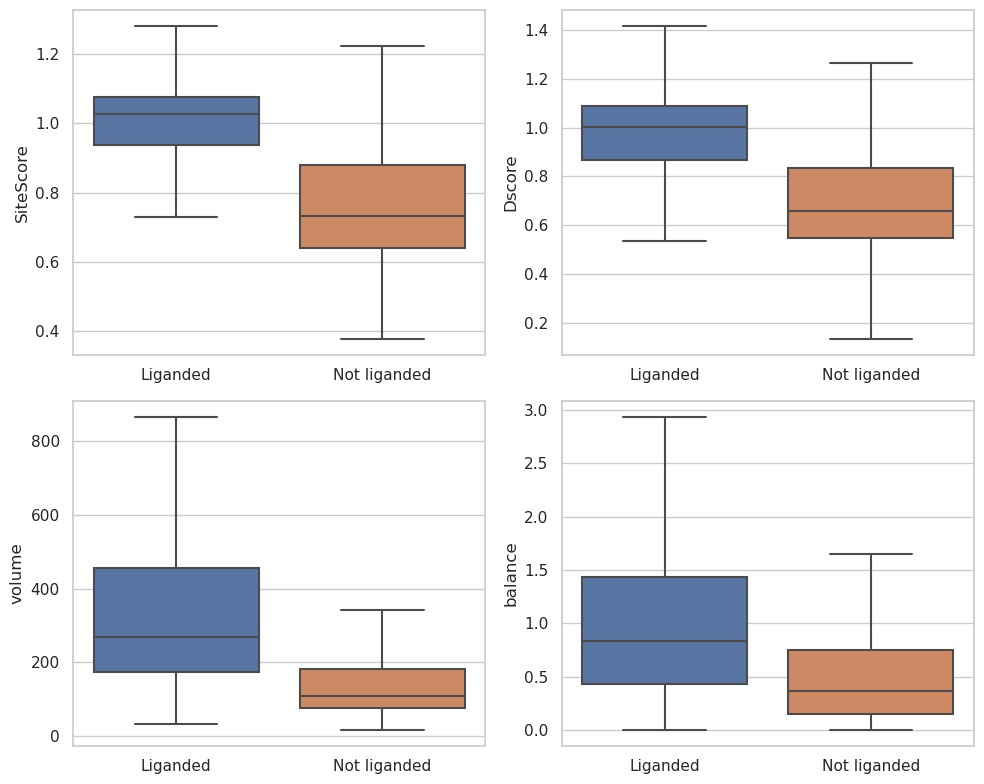
Then we compared the SiteMap metrics of liganded and not liganded sites of the PDBs with small molecule ligands. Shown in Fig. 1, the liganded sites have significantly higher SiteScore and Dscore than the not liganded sites. Therefore SiteScore is a good indicator to distinguish ligand binding sites and other sites. The median SiteScore of liganded sites is 1.03, so a SiteScore of 1.0 should be a good cutoff in prospective uses.
Fig.1. SiteMap output metric distributions of liganded sites and not liganded sites
As the PDBbind dataset contains curated binding affinity data for each structure, we further examined the relationship between SiteScores of sites and ligand binding affinities. To make sure the SiteScore represents the ligand binding site property, we focused on the sites that have greater than 0.5 site-ligand overlap defined in Equation 1. We found that the average ligand binding affinities increase as the ligand binding site SiteScores increase. Therefore a site with higher SiteScore is more likely to have a ligand with good binding affinity.
|
SiteScore range |
Number of sites |
Average ligand binding affinity (pKi) |
| 0 - 0.6 | 292 | 5.13 |
| 0.6 - 0.8 | 1353 | 5.76 |
| 0.8 - 0.9 | 1276 | 5.93 |
| 0.9 - 1.0 | 2012 | 6.37 |
| 1.0 - 1.1 | 5770 | 6.96 |
| 1.1 - 1.2 | 2643 | 6.77 |
| 1.2 + | 659 | 7.26 |