Protein Interaction Analysis Panel
Analyze the interactions at the interface of two proteins (or protein and a nucleic acid sequence), defined as two sets of chains. The analysis locates residues in the second set of chains that are within a given distance of residues in the first set of chains, and presents counts of hydrogen bonds, salt bridges, disulfide bonds, pi-pi stacking interactions, base-base, base-backbone, backbone-backbone interactions, and van der Waals clashes, and reports the van der Waals surface complementarity and buried solvent-accessible surface area.
To open this panel, click the Tasks button and browse to Biologics → Protein Interaction Analysis.
To open this panel from the entry group for the results of an antibody structure prediction job, use the Workflow Action Menu  .
.
- Using
- Features
- Additional Resources
Using the Protein Interaction Analysis Panel
The proteins whose interface you want to analyze must be part of a single project entry. They could come from a protein-protein docking run, for example, or an antibody-antigen complex, or a multi-chain protein from the PDB. The input for this panel can also include multiple protein complexes to be analyzed simultaneously. Interactions between proteins and nucleic acids can also be analyzed.
The protein that you analyze must be properly prepared, for example in the Protein Preparation Workflow Panel.
To define the two proteins:
A Workspace entry is required to begin selecting the Interaction sets, called "Set 1" and "Set 2". There must be at least one chain in each group before the analysis can be performed. If there are no entries in the Workspace, the panel will prompt you to include an entry before proceeding. Interaction sets can be defined by chains, residues, or a custom option. Chains that remain unassigned are not included in the analysis. Add selections to sets through the green Add icon and associated dropdown menu (with an available text-based search field). Remove selections from sets with the red Remove icon.
You do not have to include all the chains in the analysis, provided that there is one chain in each group. Chains that are unassigned are not analyzed.
Once you have defined the two groups, click Calculate to perform the analysis. This may take a minute or two. When the analysis is done, the results are displayed in the table.
Protein Interaction Analysis Panel Features
- Use structure(s) section
- Interaction sets section
- Advanced Options link
- Diagram button
- Calculate button
- Interactions table
- Filter link
- Fit on select option
- Import/Group poses link
- Export Table link
- Plot link
- Workspace options section
- Export to Residue Scanning button
- Use structure(s) section
-
Select the option to use either a Single structure or Multiple structures for analysis.
- Interaction sets section
-
Define the two sets of protein chains between which you want to analyze the interactions. A Workspace entry is required to begin selecting the Interaction sets, called "Set 1" and "Set 2". There must be at least one chain in each group before the analysis can be performed. If there are no entries in the Workspace, the panel will prompt you to include an entry before proceeding. Interaction sets can be defined by chains, residues, or a custom option. Chains that remain unassigned are not included in the analysis. Add selections to sets through the green Add icon and associated dropdown menu (with an available text-based search field). Remove selections from sets with the red Remove icon.
- Define sets by options
-
Define the interacting sets in terms of substructures of the proteins.
- Chain—define the sets in terms of entire chains
- Residue—define the sets in terms of individual residues
- Custom—define the sets by use of custom atom selections.
Tools for selection from a list are displayed below for the first two items; standard picking tools are displayed for the last.
- Set N list and buttons
-
Define a set by choosing items from a list.
- List area
-
This area lists the chains or residues selected for the set. You can select items for an action.
- Add button menu
-
Add an item to the list. Click the button to display the available items in a pane, which has a search bar at the top. The pane stays open so you can add multiple items. Clicking on an item adds it to the set list and removes it from the pane. If Residue is selected as the Define sets by option, check the Interface only option to show only residues that are at the interface of two proteins in the list.
- Delete icon
-
Remove the selected item from the set list. It is added back to the list in the Add pane, at the end.
- Markers option
-
Display markers in the Workspace for the items added to the set.
- Atoms for set N picking tools
-
Select atoms to define set N with the standard picking tools.
- Advanced Options link
-
Click this button if you want to change the settings that are used to analyze the protein-protein surface interactions. These settings affect the values that are listed in the table after the analysis is done. Opens the Advanced Options Dialog Box.
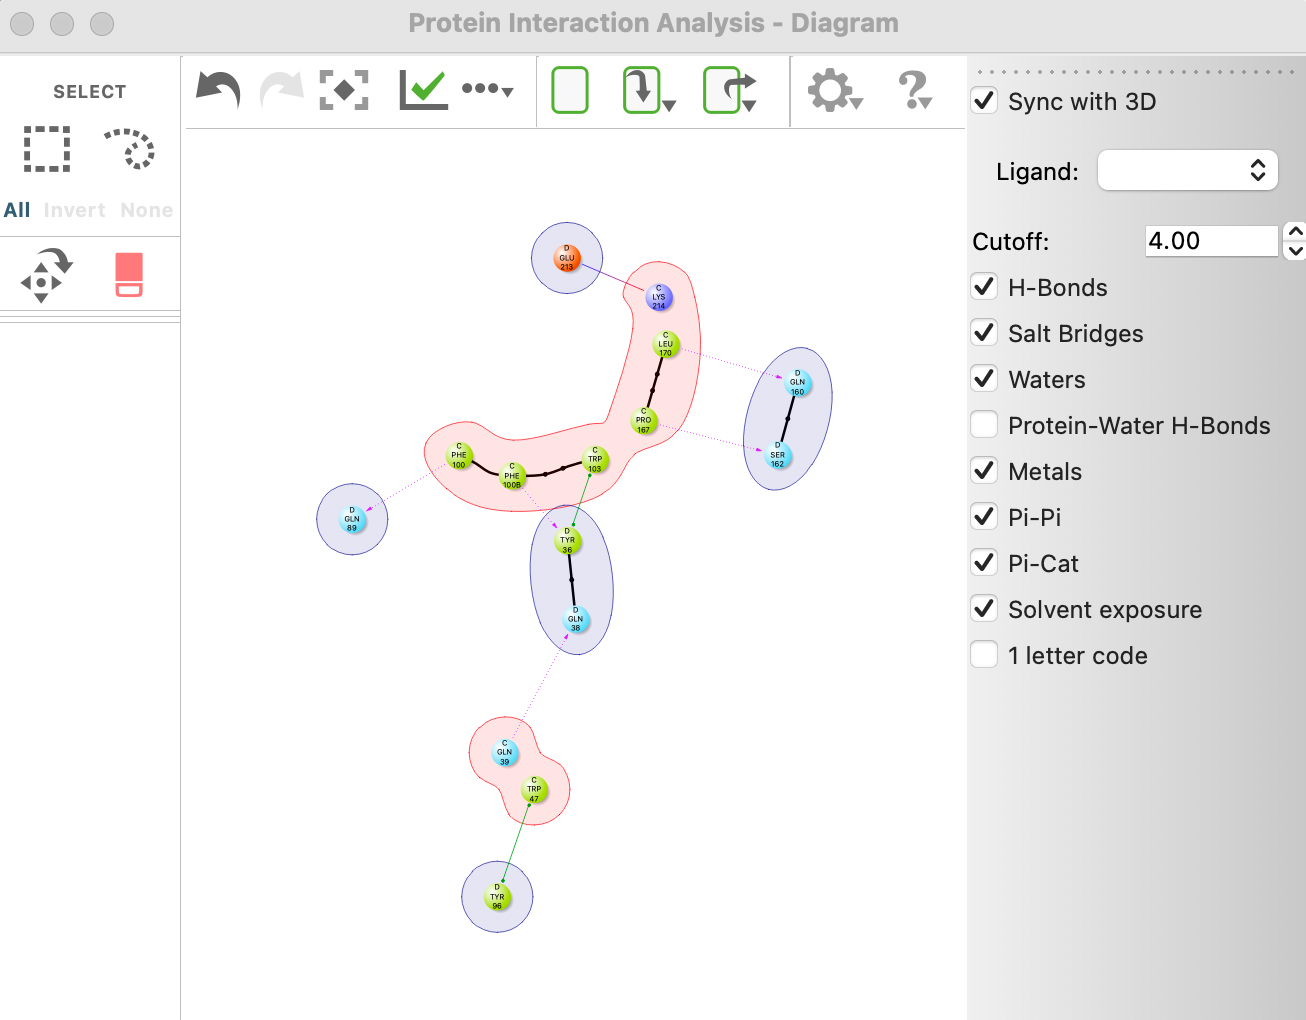
- Diagram button
-
Display a 2D protein-protein interaction diagram. Opens the Protein-Protein Interaction - Diagram dialog box, which features a subset of the controls from the Ligand Interaction Diagram Panel in addition to the diagram. Note: the right-side toolbar is unavailable for filtering interactions.
-
- Calculate button
-
Click this button to perform the analysis. This may take a minute or two. When the analysis is done, the results are displayed in the table.
- Interactions table
-
This table lists the results of the analysis. Each pair of interacting residues is listed in a separate row. The table columns are described below. You can click on a column heading to sort the table by the values in that column (except for the Specific Interactions column). When you select table rows, the residues for those rows are selected in the Workspace, and the view zooms in to those residues if you have Fit on Select turned on. Note: When using the Multiple Structures option, the table will display the average normalized values, and also a column for the percent of poses that contribute to the average normalized value.
Set1 Residue This column lists residues in Set 1 that have contact-type interactions with residues in Set 2. Set2 Residues This column lists residues from Set 2 that are within a specified distance of the residue listed in the Set 1 Residues column. The default distance is 4.0 Å. This value can be changed in the Advanced Options Dialog Box, prior to the analysis. Specific Interactions Text list of specific interactions between the Set 1 and Set 2 residues in the row. The list covers hydrogen bonds, salt bridges, pi-pi interactions, disulfides, and van der Waals clashes. Distance Smallest distance between any atoms in the Set 1 residue and Set 2 residue. # HB Number of hydrogen bonds between the Set 1 and Set 2 residues in the row. The criteria for detecting hydrogen bonds can be changed in the Advanced Options Dialog Box, prior to the analysis. # Salt Bridges Number of salt bridges between the Set 1 and Set 2 residues in the row. The criteria for detecting salt bridges can be changed in the Advanced Options Dialog Box, prior to the analysis. # Pi Stacking Number of pi-pi stacking interactions between the Set 1 and Set 2 residues in the row. The criteria for detecting pi-pi stacking interactions can be changed in the Advanced Options Dialog Box, prior to the analysis. # Disulfides Number of disulfide bonds between the Set 1 and Set 2 residues in the row. # vdW Clash Number of van der Waals clashes between the Set 1 and Set 2 residues in the row. A clash is defined as an overlap of the van der Waals radii of two atoms by more than a specified cutoff. The cutoff can be changed in the Advanced Options Dialog Box, prior to the analysis. Surface Complementarity Surface complementarity between the Set 1 and Set 2 residues in the row, as defined by Lawrence, M.C. and Colman, P. M., J. Mol. Biol.1993, 234, 946–950. Set1 Buried SASA Fraction of the solvent-accessible surface area of the Set1 residue that is buried by the interaction with the Set2 residue. Set2 Buried SASA Fraction of the solvent-accessible surface area of the Set2 residue that is buried by the interaction with the Set1 residue. -
- Filter link
-
Filter interactions listed in the Interactions table. Opens the Filter Interactions Dialog Box.
- Fit on select option
-
Fit the Workspace view to the residues in the rows selected in the table. If no rows are selected, the view zooms out to show the full structure.
- Import/Group poses link
-
This link appears if the Multiple Structures option is selected. The Import poses link appears when using structures imported from files, while the Group poses link appears when using structures imported from the Project Table. Both links allow you to import specified poses to the Project Table. You can select the option to import all poses of selected interactions, or specified poses. Additionally, you can add a default group name once the poses are specified.
- Export Table link
-
Export the contents of the interactions table to a CSV file. The file is comma-separated with a heading row.
- Plot link
-
Opens a menu with the Contact Frequency option, which generates a Contact Frequency plot.
- Workspace options section
-
Color residues in the Workspace by their interaction properties, using a color ramp between the minimum and maximum values. This menu is disabled if no poses are included in the Workspace.
- Color by option menu
-
Choose the type of interaction to color residues by. The choices are:
- Total number of specific interactions—Total number of interactions described in the Specific Interactions column (sum of the values in the # HB, # Salt Bridges, # Pi Stacking, # Disulfides, and # vdW Clash columns).
When you choose an option from this menu, the text boxes for the minimum and maximum values are updated to reflect the possible range of values.
- Color selected rows only option
-
Apply the coloring only to the residues defined by the selected rows in the interactions table.
- Show only selected rows option
-
Show in the Workspace only the residues in the selected rows of the interactions table.
- Minimum value and Maximum value settings
-
Set the minimum and maximum values of the interaction property that are used to color the residues. There are two options for each value:
- Set from table—Set the values to use for coloring to the minimum value or maximum value found in the table. The color scheme so defined is then relative to the range observed, rather than fixed.
- Set value—Set the values to use for coloring to the values in the boxes. The default minimum value is zero; the default maximum is the observed maximum for the total number of specific interactions.
- Color option menus
-
Choose the colors to represent the chosen minimum value and maximum value of the interaction. The minimum and maximum values for the color display are set with the value options, described above. The color for the minimum is applied to any value below the chosen minimum for display; likewise the color for the maximum is applied to any value above the chosen maximum for display. The colors between the two limits are obtained by a linear interpolation of the RGB color values.
- Export to Residue Scanning button
-
Export the selected interactions to the MM-GBSA Residue Scanning Panel. The button is not available until you have selected some interactions in the Interactions table. Opens the MM-GBSA Residue Scanning Panel, where you should import the structure from the Workspace (which was used for the interaction analysis) and select Stability and Affinity. The residues from the selected interactions are preselected in the MM-GBSA Residue Scanning Panel.
-

-
Reset the panel to its default settings.