FEP+ Protocol Builder Results Viewer Panel
View the results of a FEP+ Protocol Builder job.
To open this panel: click the Tasks button and browse to FEP+ → FEP Protocol Builder Results Viewer
- Using
- Features
- Additional Resources
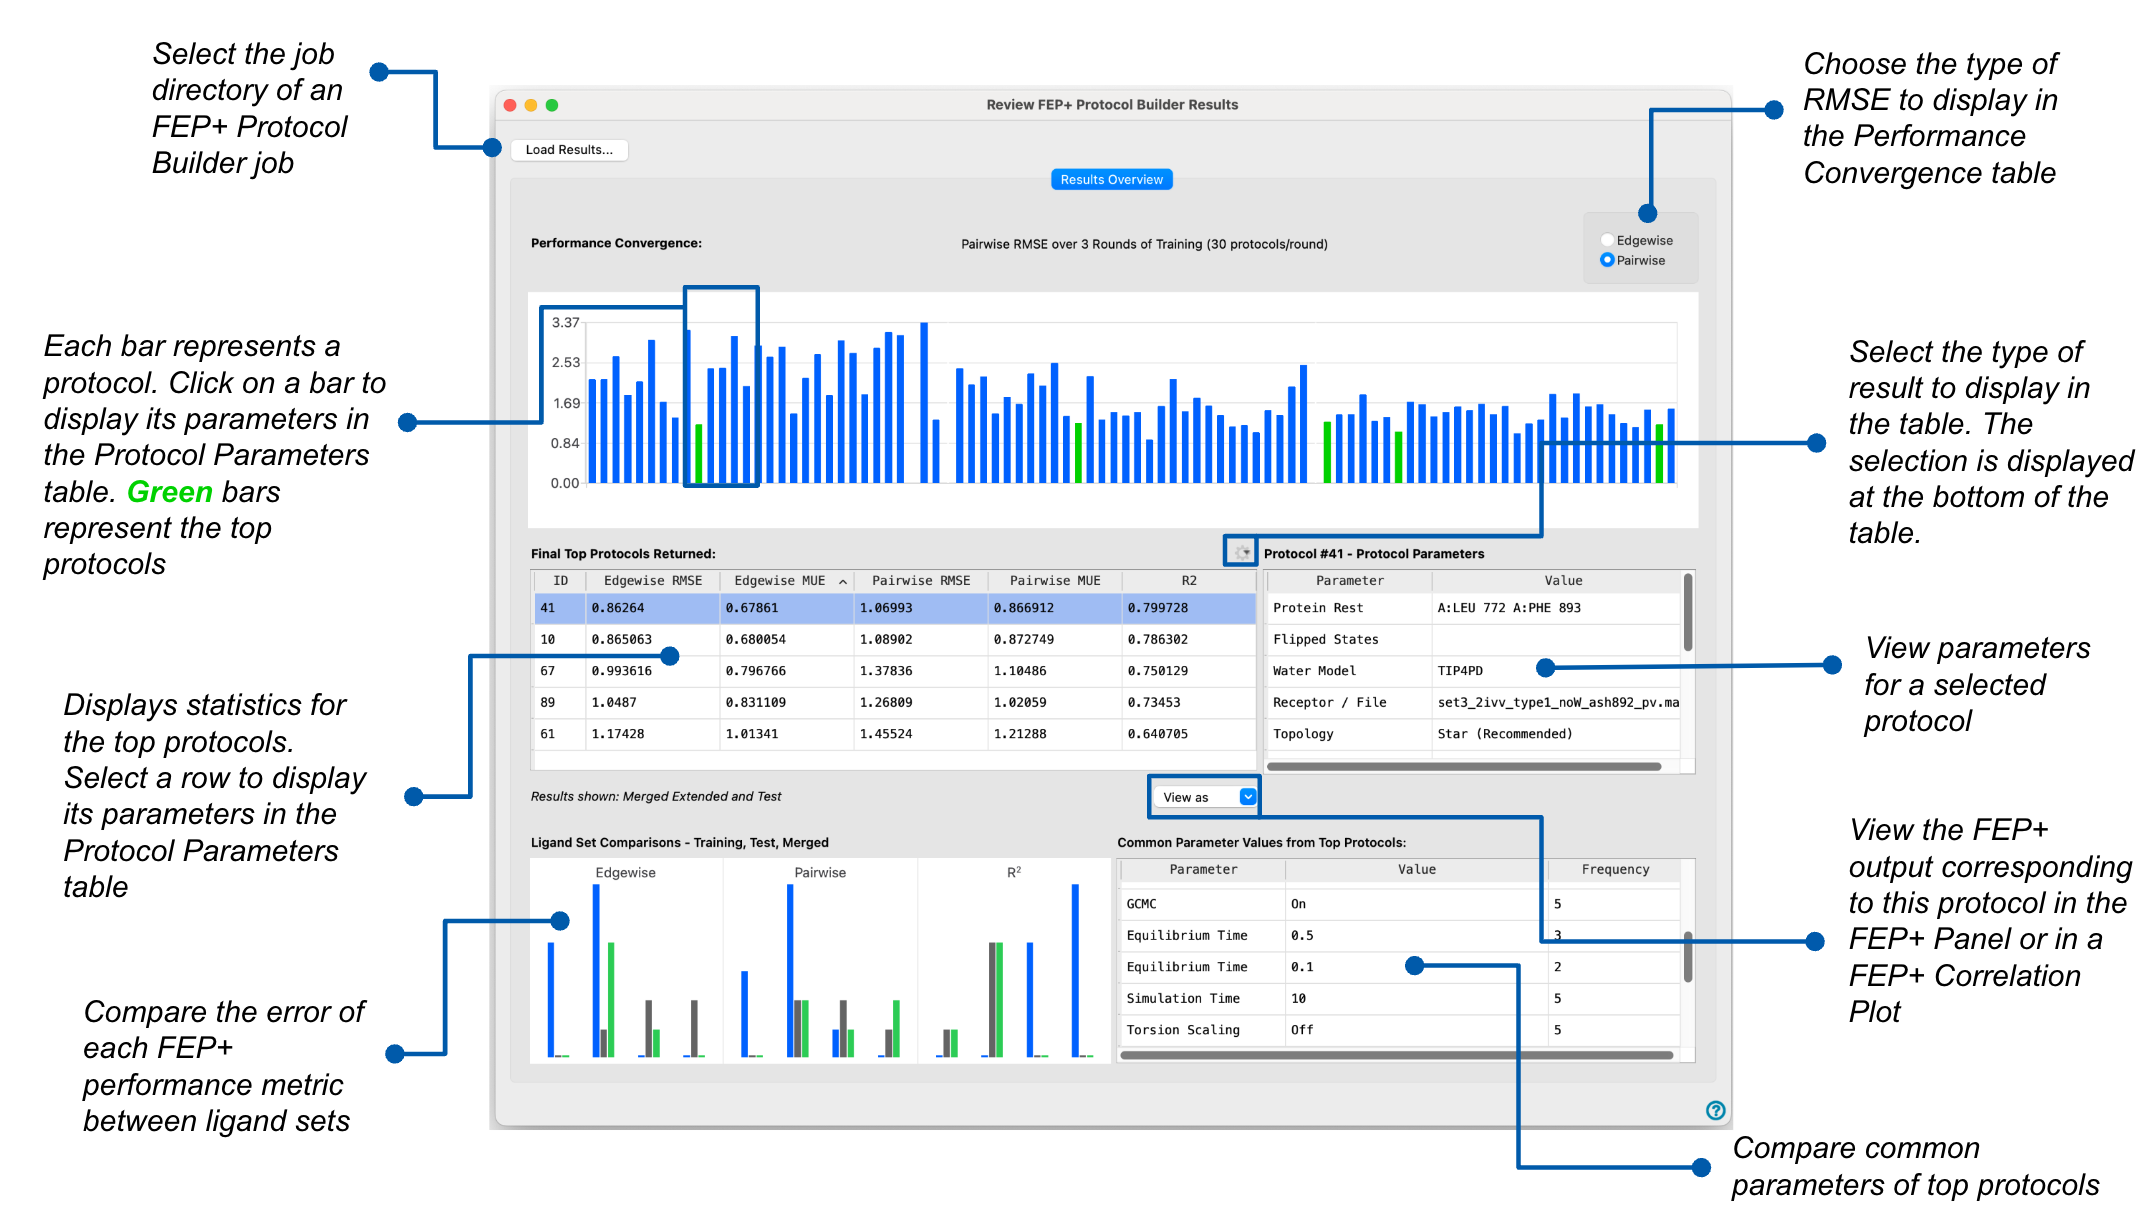
FEP+ Protocol Builder Results Viewer Panel Features
- Load Results button
- Performance Convergence section
- Final Top Protocols Returned table
- Protocol Parameters table
- Ligand Set Comparisons - Training, Test, Merged
- Common Parameter Values from Top Protocols table
- Load Results button
-
Load the results of a FEP+ Protocol Builder job into the panel. Opens a file selector, where you can navigate and choose the location of the job directory.
- Performance Convergence section
-
The bar graph displays the RMSE of the top protocols in each round of the active learning cycle. Use the Edgewise and Pairwise options on the right to change the RMSE type displayed on the y-axis. A missing bar signifies that the FEP+ calculation using that protocol has failed. Click on a bar to view its protocol parameters in the Protocol Parameters table. The final top protocols are shown in green, and listed in the Final Top Protocols Returned table.
-
Note: If any edges fail to produce a predicted ẟG during any step, the map is not counted, and the following error message is displayed: "Cannot analyze map due to missing edge data. Some edges may have failed." In this event, statistical information for that model, such as RMSE and MUE values, can still be viewed in the output.
- Final Top Protocols Returned table
-
The table displays statistics of the top protocols which have been run on both the training and test set. Select a row to display its protocol parameters in the Protocol Parameters table. Click on a column header to sort the table by the values of that column.
- Edgewise RMSE—the RMS error of the predicted affinities with respect to the experimental values for the free energy change of directly-connected edges in the graph.
- Edgewise MUE—the mean unsigned error of the predicted affinities with respect to the experimental values for the free energy change of directly-connected edges in the graph.
- Pairwise RMSE—the RMS error of the predicted affinities with respect to the relative free energy change for all ligand or mutant pairs.
- Pairwise MUE— the mean unsigned error of the predicted affinities with respect to the relative free energy change for all ligand or mutant pairs.
- R2—value of the fit of predicted to experimental affinities.
- Settings button menu
-
Select the run from which results should be displayed in the Final Top Protocols Returned table. See the Protocol Builder workflow for more information.
- Merged Extended and Test— The final error data from the merged maps of running the protocol on the training and test set.
- Test Phase—The protocols when run with an extended production time on the test set.
- Extended Simulation—The protocols run with an extended production time on the training set.
- Initial Simulation—The protocols run with a shortened production time on the training set.
- Results shown text
-
The selection from the Settings button menu is displayed as noneditable text.
- View in option menu
-
Select a protocol from the Final Top Protocols Returned table and display more detailed results from the run selected from the Settings button menu. Only available if a protocol has been selected in the Final Top Protocols Returned table.
- FEP Correlation Plot—Show a plot of experimental vs predicted ΔG with errors indicated on the plot, a list of statistics, and a histogram of ΔΔG errors. Opens the Correlation Plot (FEP+) Panel.
- FEP+ Panel—Review the ligand data and the perturbation map, and view analyses of the results of the perturbation calculations. Opens the FEP+ Panel and automatically loads the map file (
.fmp) of the selected run. The settings of the selected run are also loaded.
- Protocol Parameters table
-
Displays the parameters of the selected protocol from the Performance Convergence section or Final Top Protocols Returned table. The protocol ID is shown at the top of the table. See the parameter table for more information on the parameters. These parameters form the optimal protocol for your system, as determined by the FEP+ Protocol Builder, and can be used to perform prospective FEP+ calculations.
- Ligand Set Comparisons - Training, Test, Merged
-
Histogram of the Edgewise RMSE, Pairwise RMSE, and R2. The counts of the Training (blue), Test (brown), and Merged (green) sets are compared side by side. Hover over a bar to display more information on it.
- Common Parameter Values from Top Protocols table
-
Parameters whose value is the same across two or more protocols in the Final Top Protocols Returned table are listed. The Frequency column shows how many protocols in the Final Top Protocols Returned table have the value displayed in the Value column.