Calculate Band Shape Panel
Calculate the spectrum of an electronic transition between the ground state and the lowest singlet or triplet state, including the Franck-Condon vibrational envelope, at multiple temperatures.
To open this panel: click the Tasks button and browse to Materials → Quantum Mechanics → Band Shape → Band Shape Calculations.
The following licenses are required to use this panel: MS Maestro, Jaguar
- Using
- Features
- Additional Resources
Using the Calculate Band Shape Panel
Calculating the band shape can involve generation of a large number of vibrational transitions, which is time-consuming. As many of these lines may not have much intensity, you can use the Limit normal modes text boxes and the Min intensity text box to reduce the number of transitions computed. You can further reduce the number of lines actually used in the plot by intensity screening in the Spectrum Plot Panel.
It is recommended that you run the calculation at zero temperature first, then import the restart files to run the band shape calculation at nonzero temperatures.
You can submit jobs for multiple structures by using the Project Table as the structure source and selecting multiple entries. A job is submitted for each entry when you click Run.
To write out the input file and a script for running the job from the command line, click the arrow next to the Settings button  and choose Write.
When the job finishes and the structure is incorporated into the project, you can plot the spectra in the Spectrum Plot Panel (Quantum Mechanics → Plot Spectra). To open this panel from the entry group for the results of a job .
.
In the Spectrum Plot Panel:
- For Type, choose UV/Vis.
- To plot each temperature separately in a vertical stack, for Multiple spectra, choose Stacked.
- To normalize the spectra to 100% for the maximum intensity, select Normalize.
- To speed up loading, increase the value in the Trim band shape spectra by removing lines with intensities less than N % of the maximum text box; for a more accurate spectrum, decrease this value.
In addition to the structure used to generate the spectrum, structures for the initial state and the final state are also included along with their vibrational data, so you can examine the vibrational modes in the Vibrations Panel.
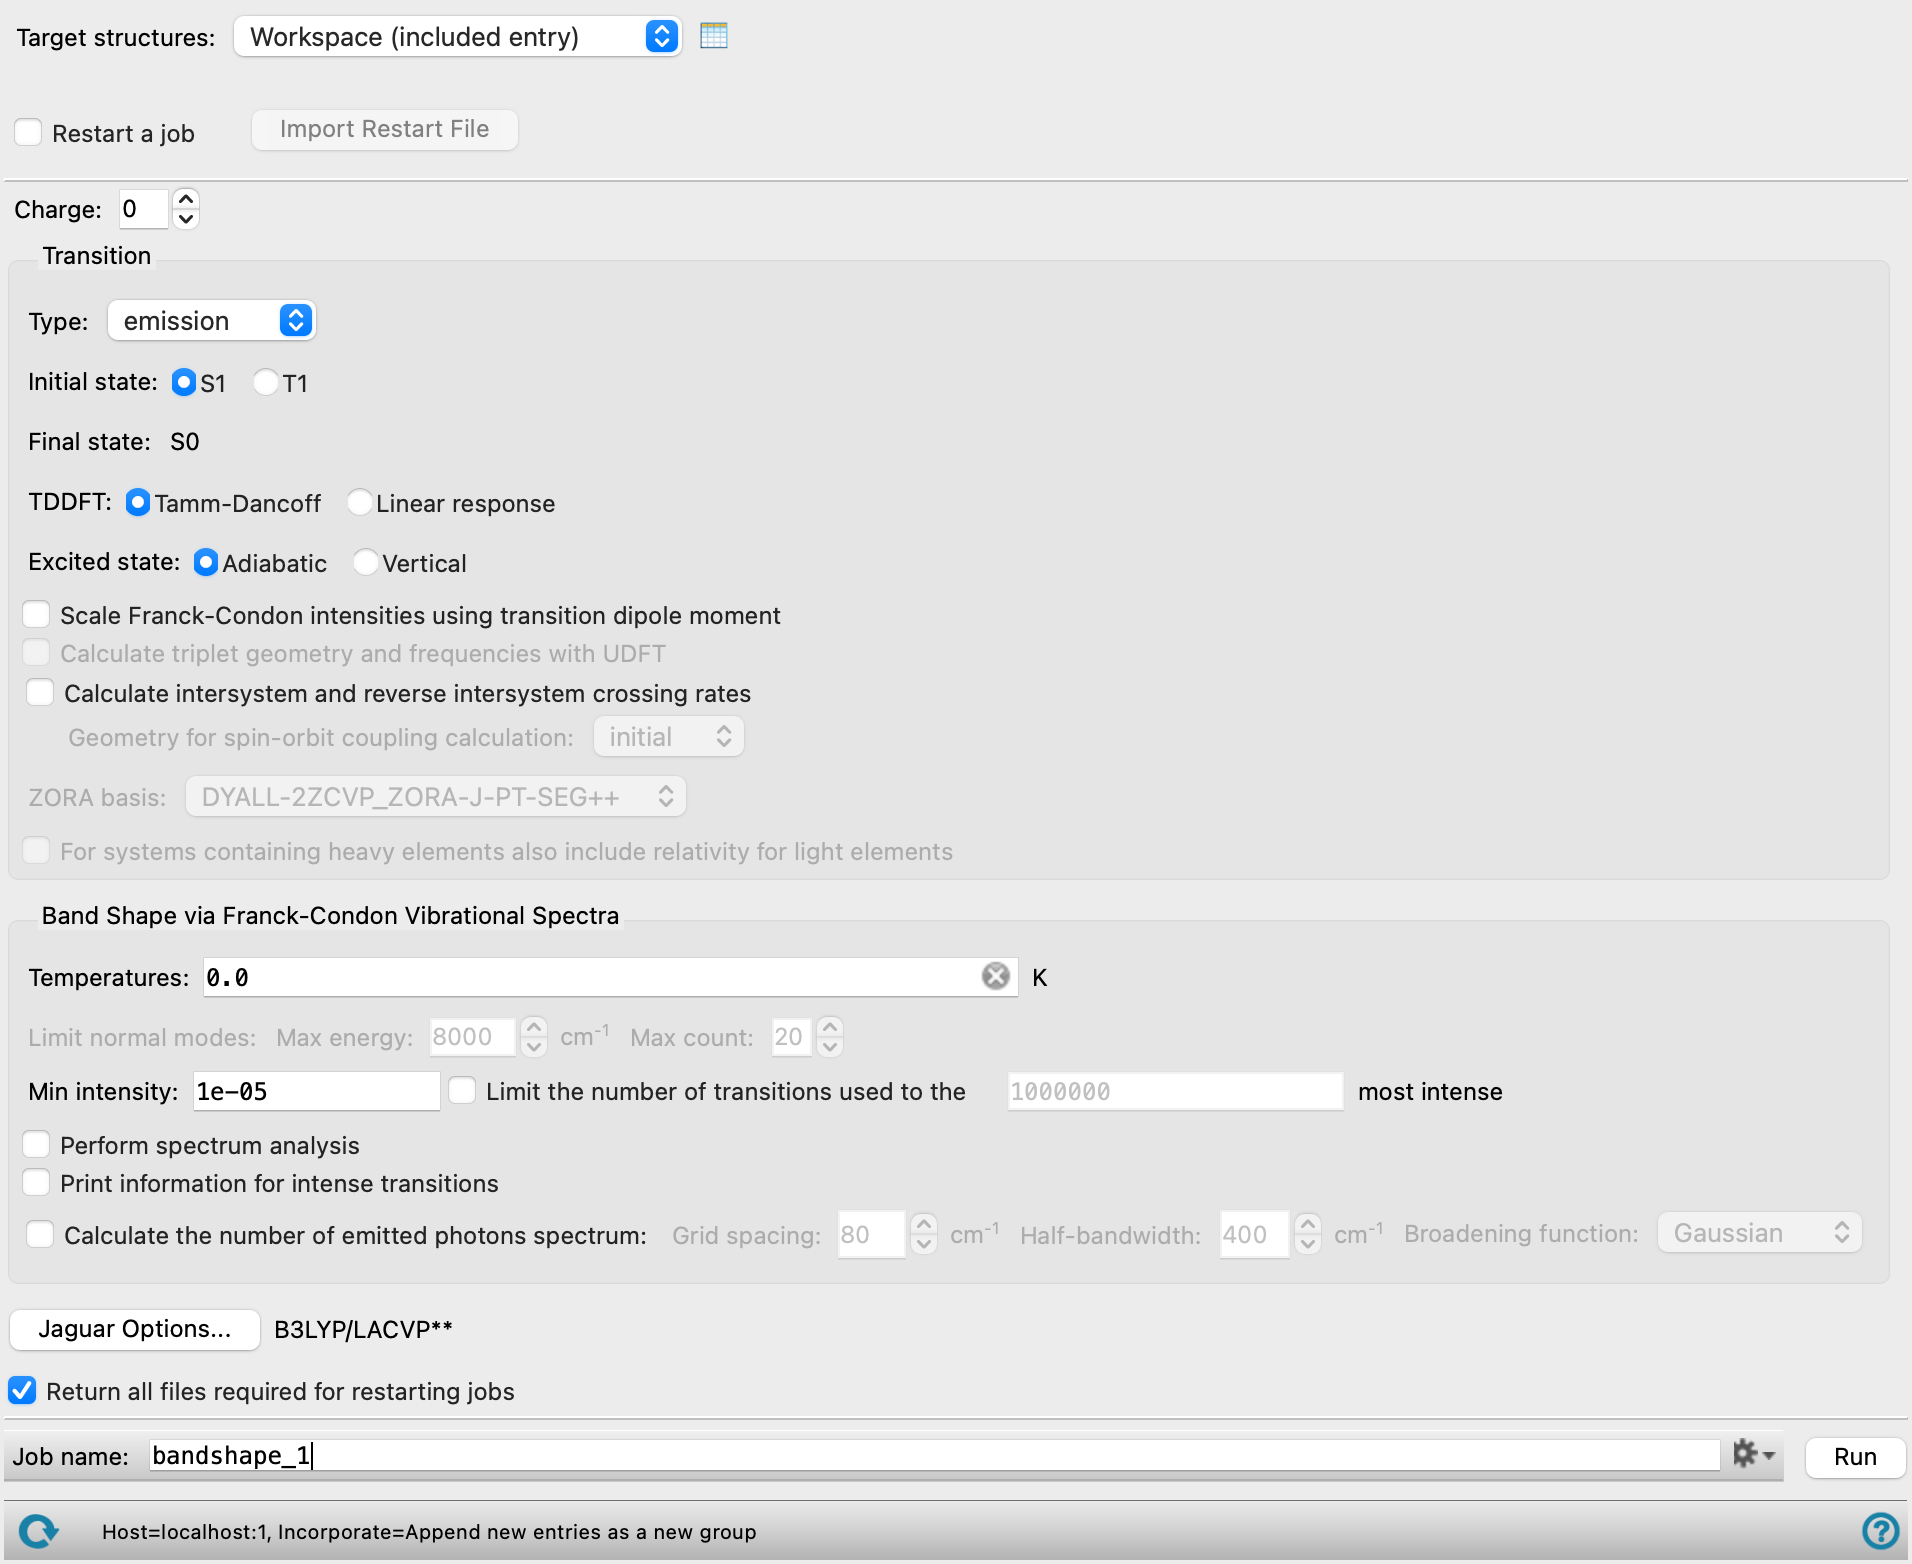
Calculate Band Shape Panel Features
- Target structure option menu
- Open Project Table button
- File name text box and Browse button
- Restart a job option
- Import Restart File button
- Charge text box
- Transition section
- Type option menu
- Initial state options or text
- Final state options or text
- TDDFT options
- Excited State options
- Scale Franck-Condon intensities using transition dipole moment option
- Calculate triplet geometry and frequencies with UDFT option
- Calculate intersystem and reverse intersystem crossing rates option
- Geometry for spin-orbit coupling calculation option menu
- ZORA basis option menu
- For systems containing heavy elements also include relativity for light elements option
- Band shape via Franck-Condon Vibrational Spectra section
- Temperatures text box
- Limit normal modes text boxes
- Min intensity text box
- Limit the number of transitions used to the N most intense option and text box
- Perform spectrum analysis option
- Print information for intense transitions option
- Calculate number of emitted photons spectrum option
- Calculate molar absorptivity spectrum option
- Options button
- Return all files required for restarting jobs option
- Job toolbar
- Status bar
- Target structure option menu
-
Choose the structure source for the band shape calculation. If you select multiple entries in the Project Table, a band shape calculation is run for each entry as a separate job.
- Project Table (n selected entries)—Use the entries that are currently selected in the Project Table or Entry List. The number of entries selected is shown on the menu item.
- Workspace (included entry)—Use the entry that is currently included in the Workspace. Only one entry must be included in the Workspace.
- File—Use the specified file. When this option is selected, the File name text box and Browse button are displayed.
- Project Table (n selected entries)—Use the entries that are currently selected in the Project Table or Entry List. The number of entries selected is shown on the menu item.
- Open Project Table button
-
Open the Project Table panel, so you can

- File name text box and Browse button
-
Enter the file name in this text box, or click Browse and navigate to the file. The name of the file you selected is displayed in the text box.
- Restart a job option
-
Select this option to restart a job. You can restart a job that failed in the electronic structure stage or in the band shape calculation stage. You can also restart a completed job and change the band shape settings to generate spectra at different temperatures or with different cutoffs for the vibrational transitions.
The Import Restart File button is activated so you can select the restart file.
When you select this option, the controls in the Transition section are made unavailable, so you cannot change them. You can make changes in the Band shape section, to set up band calculations at different temperatures for the same electronic transition. When you deselect this option, the remaining options are available again and retain the values set before selecting this option.
- Import Restart File button
-
Import a band shape restart file to restart a band shape job. Opens a file selector, so you can locate the restart file,
jobname.01.inp. - Charge text box
-
Specify the charge on the molecule. The molecule with this charge must be a closed-shell molecule.
- Transition section
-
Set options for the electronic transition whose band shape is to be calculated.
- Type option menu
-
Choose the type of spectrum, from absorption or emission. The Initial state and Final state controls change according to the choice you make.
- Initial state options or text
-
Select the initial state for emission, from S1 (first excited singlet) or T1 (first excited triplet). If absorption, reports the initial state as the ground state, S0.
- Final state options or text
-
Select the final state for absorption, from S1 (first excited singlet) or T1 (first excited triplet). If emission, reports the final state as the ground state, S0.
- TDDFT options
-
Choose the TDDFT method for the excited state. This is used for all excited singlet calculations, and is the default for the excited state triplet geometry and frequencies. TDDFT is always used for the calculation of transition dipole moments and spin-orbit coupling.
- Tamm-Dancoff—use the Tamm-Dancoff approximation.
- Linear response—use the full linear response method.
- Excited State options
-
Choose the method for obtaining the exited state geometries and vibrational frequencies [40,41].
- Adiabatic—perform an excited state geometry optimization and vibrational frequency calculation. This method provides more accurate results but takes more time to run.
- Vertical—perform a single excited state gradient calculation at the ground state geometry instead of a full geometry optimization and reuse the ground state vibrational frequencies for the excited state. These approximations greatly reduce the computational effort.
- Scale Franck-Condon intensities using transition dipole moment option
-
To adjust the spectrum so that its intensity is proportional to the electronic transition intensity, select this option. The transition dipole moment is calculated at the optimized initial state geometry. If T1 is one of the states involved in the transition, the transition dipole moment is calculated with a 2-component ZORA calculation.
- Calculate triplet geometry and frequencies with UDFT option
-
Calculate the triplet state geometry and vibrational frequencies using spin-unrestricted DFT (UDFT). This is usually much faster than using TDDFT, the default if this option is off. The transition dipole moment and the spin-orbit coupling are still calculated by TDDFT in a single-point calculation. This option is only available when T1 is one of the states involved in the transition.
- Calculate intersystem and reverse intersystem crossing rates option
-
Calculate the intersystem crossing (nonradiative S1 → T1) and reverse intersystem crossing (nonradiative T1 → S1) rates and report the results as Maestro properties for the output structure. The necessary S1 calculations are performed automatically. The rates require a spin-orbit coupling calculation between the singlet and triplet states.
- Geometry for spin-orbit coupling calculation option menu
-
Choose the geometry at which the single-point calculation for the spin-orbit coupling is made for ISC and RISC calculations. This option is only available when Calculate intersystem and reverse intersystem crossing rates is selected.
- initial—use the geometry of the initial state.
- final—use the final state geometry.
- singlet—use the geometry of the S1 state.
- ZORA basis option menu
-
Choose the basis set for the ZORA calculation, which is needed for spin-orbit coupling matrix elements . The calculation for ISC and RISC is done at a single geometry, chosen from the Geometry for spin-orbit coupling option menu. This option menu is only available when Calculate intersystem and reverse intersystem crossing rates is selected.
- For systems containing heavy elements also include relativity for light elements option
-
When there is a heavy element (Z > 18) in the calculations, use the ZORA method and ZORA basis sets for all elements, light and heavy. The default is not to use ZORA for the light elements, as the spin-orbit coupling in the molecule is assumed to be dominated by the heavy element, and this makes the calculations faster.
If the structure contains only light elements (Z ≤ 18), ZORA is used by default for light elements because the spin-orbit coupling for the ISC comes only from the light elements.
- Band shape via Franck-Condon Vibrational Spectra section
-
Set options for the calculation of the band shape itself.
- Temperatures text box
-
Enter the temperatures to calculate the band shape at, in kelvin, separated by spaces. The default is 0 K. It is recommended that you run the calculation at 0 K first, then use the restart capabilities to run the band shape calculations at other temperatures.
- Limit normal modes text boxes
-
Limit the number of normal modes used in the band shape calculation by energy or number. These text boxes are only available when running the calculation at temperatures other than 0 K. Both limits are applied, so the level number and the energy must both meet these criteria.
- Max energy—specify the maximum vibrational energy for any normal mode, in cm−1.
- Max count—specify the maximum number of vibrational quanta in any mode.
- Min intensity text box
-
Specify the minimum intensity of any vibrational transition to be included.
- Limit the number of transitions used to the N most intense option and text box
-
Limit the number of transitions used in the calculation to the specified number, counting from the most intense. For systems with a large number of intense transitions, limiting the number of transitions reduces resource usage and time taken. By default, no limit is applied.
- Perform spectrum analysis option
-
Write out the initial and final energies, transition energy, transition dipole moment, intensity, and initial and final state quanta for all transitions. The data is written to the file
jobname.analysis. This option produces large quantities of data and uses a large amount of memory, so it should only be done on small molecules. - Print information for intense transitions option
-
Print information on the vibrational states involved in the most intense transitions. This requires storing information on all vibrational states, which can use a large amount of memory.
Setting this option allows you to perform a vibrational mode analysis of regions of the spectrum from the Spectrum Plot Panel, to determine what functional groups may be important in the transition. See Vibrational Normal Mode Analysis Dialog Box for more information.
- Calculate number of emitted photons spectrum option
- Calculate molar absorptivity spectrum option
-
Calculate the spectrum for the molar absorptivity or the number of emitted photons, by convolution with Gaussian or Lorentzian broadening functions. The text of the option depends on the choice made from the Type option menu.
- Grid spacing text box
-
Specify the grid spacing in eV for the convolution process.
- Half-bandwidth text box
-
Specify the width at half maximum in eV for the broadening function to use for each line.
- Broadening function option menu
-
Choose the type of broadening function to use, from Gaussian or Lorentzian.
- Options button
-
Set Jaguar options for the transition and vibrational mode calculations. Opens the Jaguar Options - Calculate Band Shape Dialog Box. This dialog box also allows you to specify additional Jaguar keywords. The solvent (if any), level of theory, and basis set are shown to the right of the button.
- Return all files required for restarting jobs option
-
Return all the files needed to restart a job to the working directory. The restart files are used to restart the calculation of the electronic transition. If you plan to run multiple temperatures for the same transition in different jobs by restarting the job, you will need these files from the first job for the transition, but you will not need to copy them back for jobs that are just calculating the band shape.
- Job toolbar
-
Manage job submission and settings. See Job Toolbar for a description of this toolbar.
The Job Settings button opens the Calculate Band Shape - Job Settings Dialog Box, where you can make settings for running the job.
- Status bar
-
The status bar displays information about the current job settings and status for the panel. The settings includes the job name, task name and task settings (if any), number of subjobs (if any) and the host name and job incorporation setting. The job status can include messages about job start, job completion and incorporation.
Use the Reset button
 to reset the panel to its default settings and clear any data from the panel.
 The status bar also contains the Help button
 , which opens the help topic for the panel in your browser. If the panel is used by one or more tutorials, hovering over the Help button displays a
  button, which you can click to display a list of tutorials (or you can right-click the Help button instead). Choosing a tutorial opens the tutorial topic.