Cluster Analysis Viewer Panel
surfactant, detergent
Display plots of molecular cluster properties as a function of time and final cluster compositions.
To open this panel: click the Tasks button and browse to Materials → Classical Mechanics → Trajectory Analysis → Cluster Analysis Results.
To open this panel from the entry group for the results of a job .
.
The following licenses are required to use this panel: MS Maestro
- Features
- Additional Resources
Cluster Analysis Viewer Panel Features
- Load from Workspace button
-
Load the results of a cluster analysis from the entry for the structure that is in the Workspace. If you use the Workflow Action Menu to open this panel, the results are loaded automatically.
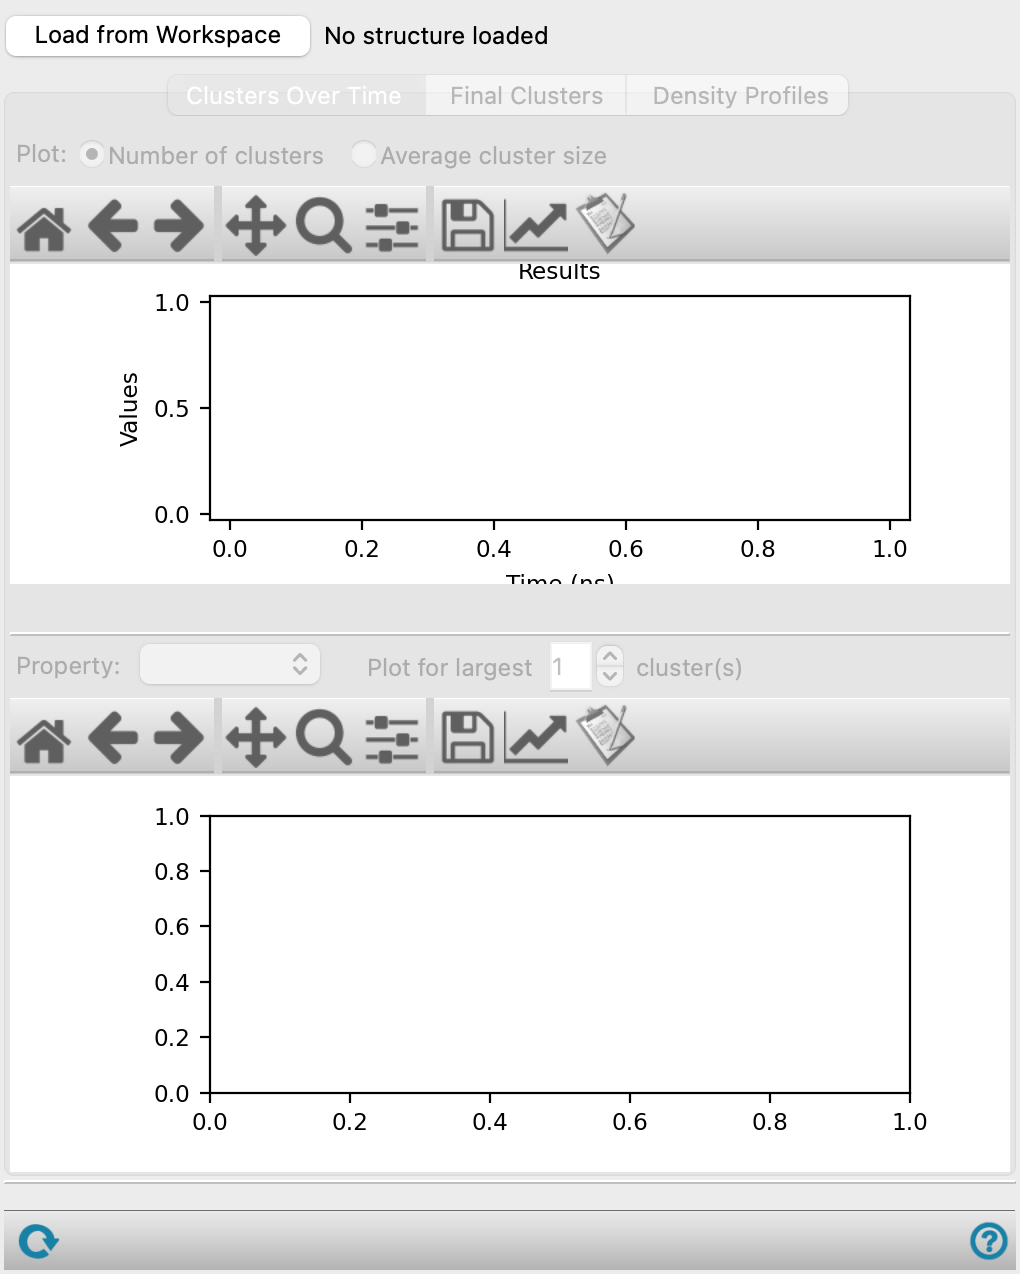
- Clusters Over Time tab
-
- Plot options
-
Chose the type of plot to display in the upper plot area. The options are:
- Number of clusters—Plot the number of clusters as a function of simulation time.
- Average cluster size—Plot the average cluster size as a function of simulation time.
- Plot toolbar
-
The toolbar has tools for manipulating the plot and for saving images. The buttons that are common to all plot toolbars are described in the Plot Toolbar topic.
- Upper plot area
-
Use the Plot options above to determine what is displayed. If Number of clusters is selected, this area displays the plot of number of clusters against simulation time in ns. If Average cluster size is selected, this area displays the plot of average cluster size (measured by the number of molecules in the cluster) against simulation time in ns.
- Final number of clusters summary text
-
Gives the number of clusters at the last trajectory frame.
- Final average cluster size summary text
-
Gives the average cluster size at the last trajectory frame.
- Property option menu
-
Choose the property to plot for the largest clusters in the lower plot area. Apart from the number of molecules, these properties describe aspects of the shapes of the clusters.
- Plot for largest N clusters text box and arrows
-
Choose the number of clusters to plot the property for, in decreasing order of size.
- Plot toolbar
-
The toolbar has tools for manipulating the plot and for saving images. The buttons that are common to all plot toolbars are described in the Plot Toolbar topic.
- Lower plot area
-
This area displays the plot of the chosen property against simulation time in ns. A different color is used for each cluster, and a legend is displayed for the line colors when the property is plotted for multiple clusters. The clusters are sorted by size at each trajectory frame, so the composition of the largest n-th cluster may not be constant throughout the simulation.
- Final Clusters tab
-
This tab displays information about the clusters in the last trajectory frame.
- Select cluster atoms in the Workspace option
-
When you choose this option, selecting an entry in the Summary table also selects all the atoms of the corresponding cluster in the Workspace. The structure with all the clusters is automatically included in the Workspace (if it is not already there).
- Summary table
-
The summary table lists all the clusters in the last trajectory frame and gives information about their composition, age, and other properties. The columns are as follows:
- Clusters—The clusters of the last trajectory frame are listed in decreasing order of size.
- Molecule composition columns—Each unique molecule in the system has a column showing how many units of that molecule is in the cluster. The column headings show the identity of each molecule (chemical formula, coarse-grained particle composition, or polymer name) and the total number of instances of the molecule in the simulation box.
- Age (frames)—The number of trajectory frames in which the cluster composition has not changed.
- Average RG—The radius of gyration of the cluster averaged over all trajectory frames in which the cluster composition has not changed. The method for this calculation is selected in the Cluster Analysis Panel.
- Average Eccentricity—The eccentricity of the cluster averaged over all trajectory frames in which the cluster composition has not changed.
- Density Profiles tab
-
This tab displays a plot of the density profile for each final cluster as a function of the radial distance.
- Profile to plot options
-
Specify the density profile to plot:
- Show averaged—Plot the density profile as an average of all of the final clusters.
- Show individual clusters—Plot discrete density profiles for each of the final clusters.
- Plot clusters option menu
-
Choose the clusters whose density profile you want to examine. Each selection name has a check box, so you can select multiple items to plot. Only available when Show individual clusters is selected for Profile to plot.
- Plot species option menu
-
Choose the structure components whose density profile you want to examine. Each selection name has a check box, so you can select multiple items to plot. Select All from the option menu to view the combined density profile for each species.
- Time range slider and text boxes
-
Control the simulation time for which the density profile is plotted. The plot updates when the slider is dragged to a different simulation time or when the text boxes are edited.
- Plot toolbar
-
The toolbar has tools for manipulating the plot and for saving images. The buttons that are common to all plot toolbars are described in the Plot Toolbar topic.
- Plot area
-
This area displays the plot of number density in nm-3 against radial density in Angstrom. Use the options above to determine which density profiles are displayed.
- Status bar
-
 to reset the panel to its default settings and clear any data from the panel.
If you can submit a job from the panel, the status bar displays information about the current job settings and status for the panel. The settings include the job name, task name and task settings (if any), number of subjobs (if any) and the host name and job incorporation setting. The job status can include messages about job start, job completion and incorporation.
The status bar also contains the Help button
 , which opens an option menu with choices to open the help topic for the panel (Documentation), launch Maestro Assistant, or if available, choose from an option menu of Tutorials. If the panel is used by one or more tutorials, hover over the Tutorials option to display a list of tutorials. Choosing a tutorial opens the tutorial topic.