Coarse-Grained Force Field Viewer Panel
Analyze the convergence and quality of force field parameters generated from a coarse-grained force field builder calculation.
To open this panel: click the Tasks button and browse to Materials → Classical Mechanics → Coarse Grain Models → Coarse-Grained Force Field Builder Results.
To open this panel from the entry group for the results of a job .
.
The following licenses are required to use this panel: MS Maestro, MS CG
- Features
- Additional Resources
Coarse-Grained Force Field Viewer Panel Features
- Load from Workspace button
-
Load the results of a coarse-grained force field builder job from the entry for the structure that is in the Workspace. If you use the Workflow Action Menu to open this panel, the results are loaded automatically.
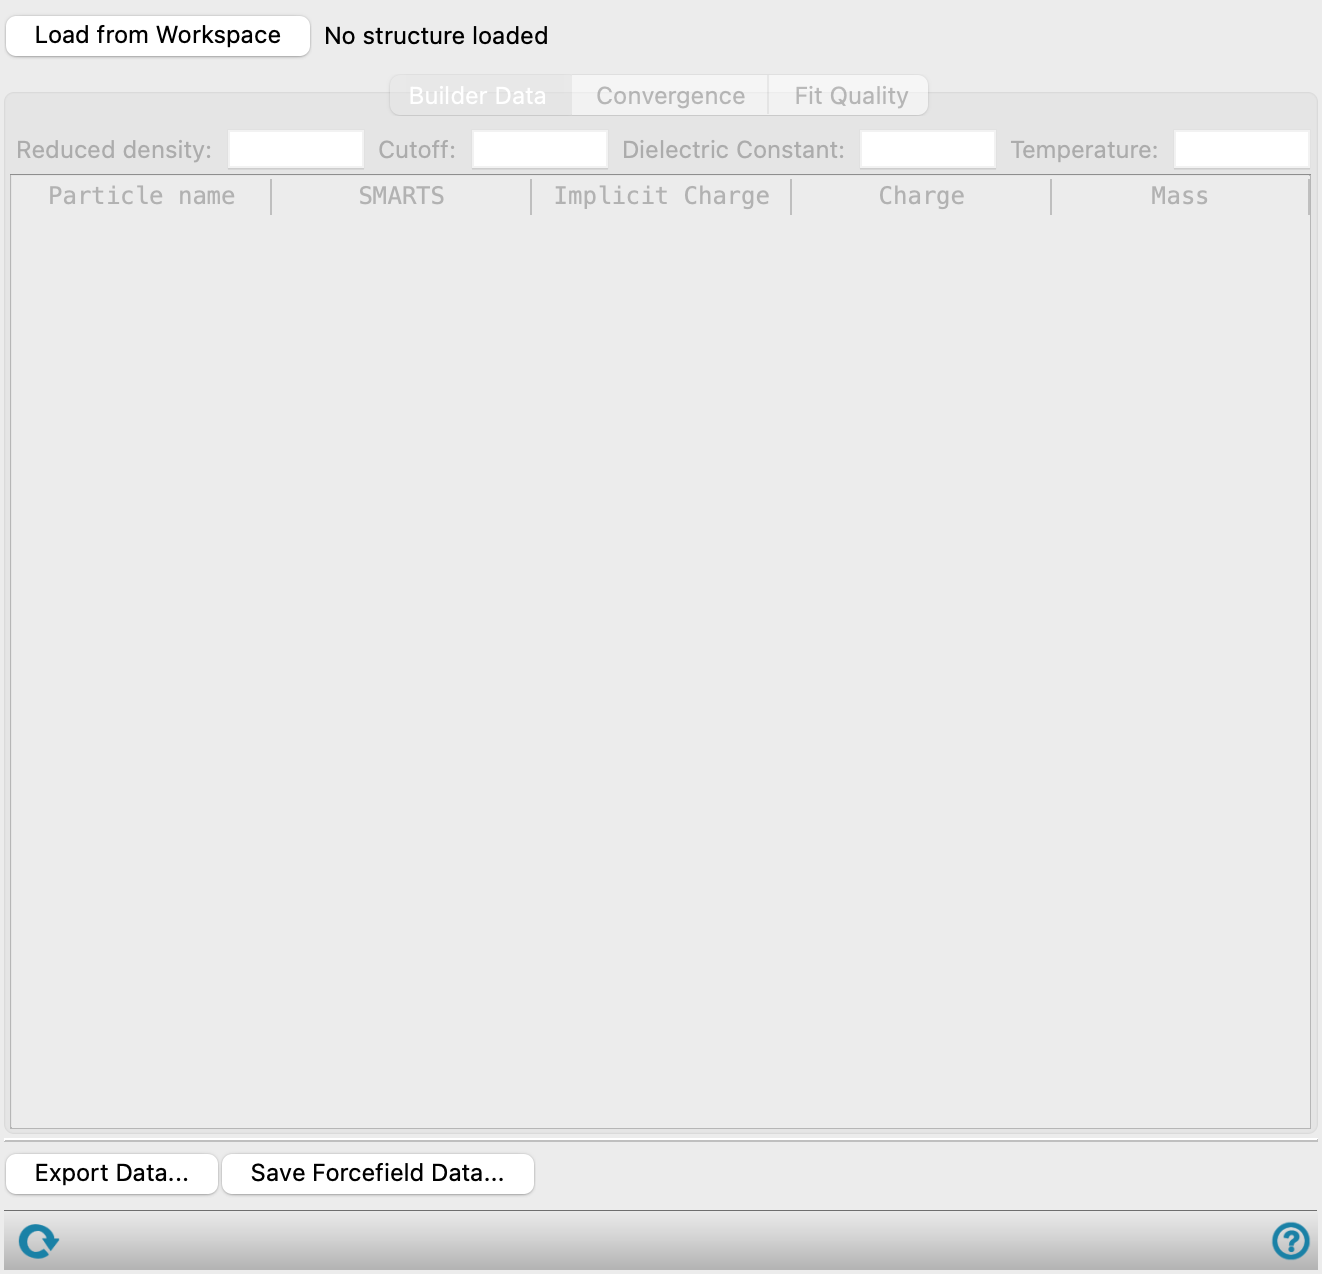
- Builder Data tab
-
Contains a summary of input parameters set in the Coarse-Grained Force Field Builder Panel.
- Reduced density text box
-
The value density specified in the Reduced density text box of the Coarse-Grained Force Field Builder Panel. Noneditable.
- Cutoff text box
-
The value specified in the Cutoff distance text box of the Coarse-Grained Force Field Builder Panel. Noneditable.
- Dielectric Constant text box
-
The value specified in the Dielectric constant text box of the Coarse-Grained Force Field Builder Panel. Noneditable.
- Temperature text box
-
The value specified in the Temperature text box of the Coarse-Grained Force Field Builder Panel. Noneditable.
- Builder data table
-
A summary table which lists each particle specified in the Map Atoms tab of the Coarse-Grained Force Field Builder Panel as a row. The Particle name, SMARTS, and Implicit Charge columns are parameters specified in the Coarse-Grained Force Field Builder Panel. The Mass column is a parameter specified by the user if the Use common mass option is selected in the Coarse-Grained Force Field Builder Panel, and otherwise automatically determined. The Charge column should be disregarded, as explicit charges are not currently supported. The table is noneditable, but you can double-click on a cell to copy the value.
-
- Convergence tab
-
Plot the force field parameters fitted with the Coarse-Grained Force Field Builder Panel against the number of fitting iterations to visualize how they change throughout the fitting procedure.
- Forcefield type option menu
-
Choose the category of fitting parameters to display. Nonbonds, Bonds, and Angles are available as options, depending on what was specified in the Coarse-Grained Force Field Builder Panel.
- Type option menu
-
Choose the parameter type to display on the plot. The parameter types available are determined by the Forcefield type. Choose All to select all parameter types to display on the plot, and None to reset the plot. By default, all parameter types are selected.
- Plot toolbar
-
The toolbar has tools for manipulating the plot and for saving images. The buttons that are common to all plot toolbars are described in the Plot Toolbar topic.
- Plot area
-
Displays the values of the fitting parameters against the total number of iterations.
- If Nonbonds is selected as the Forcefield type, the repulsive harmonic potential (a) is plotted in units of kcal mol-1 Å-2. For Martini fitting, van der Waals radius (σ) and the interaction strength (ε) are plotted on two separate plots in units of angstroms and kcal mol-1, respectively.
- If Bonds is selected as the Forcefield type, the bond distance (Req) and force constant for bonds between particles (k) are plotted on two separate plots in units of angstroms and kcal mol-1 Å-2, respectively.
- If Angles is selected as the Forcefield type, the equilibrium angle (θeq) and force constant for angles (k) are plotted on two separate plots in units of degrees and kcal mol-1 rad-2, respectively. For Martini fitting, the force constant for angles (k) is plotted in kcal mol-1.
- Fit Quality tab
-
Show the R-squared value for fitting parameters and analyze how fitting parameters compare against an all-atom reference at specific fitting iterations.
- Forcefield type option menu
-
Choose the category of fitting parameters to display. Nonbonds, Bonds, and Angles are available as options, depending on what was specified in the Coarse-Grained Force Field Builder Panel.
- Type option menu
-
Choose the parameter type to display on the plot. The parameter types available are determined by the Forcefield type. Only one parameter type can be plotted at a time. Only present when the Plot tab is selected.
- g(r) option
-
Show the pair distribution function for the parameter specified in the Type option menu. Only available when the Plot tab is selected and Forcefield type is Nonbonds.
- Integral option
-
Show the integral of the pair distribution function for the parameter specified in the Type option menu. The comparison of the integrals against the all-atom reference is a particularly important indication of the fit quality, as the value of the integral at the cutoff distance is used directly in the fitting procedure. Only available when the Plot tab is selected and Forcefield type is Nonbonds.
- R-squared tab
- Plot tab
-
Visualize how the fitting parameters in the coarse-grained model compare against an all-atom reference.
- Plot toolbar
-
The toolbar has tools for manipulating the plot and for saving images. The buttons that are common to all plot toolbars are described in the Plot Toolbar topic.
- Plot area
-
For the parameter specified in the Type option menu, a reference from an all-atom system is plotted in red. The quality of the fit at specific iterations can be compared against the reference. The iterations to plot can be determined using the Iterations to display and Number of profiles to display text boxes. A legend at the bottom of the plot indicates the line color for a specific iteration number. If Forcefield type is Nonbonds, either the pair distribution function or its integral is plotted against the distance between the particles. If Forcefield type is Bonds, the bond frequency is plotted against the bond length. If Forcefield type is Angles, the angle frequency is plotted against the angle value.
-
- Iterations to display slider and text boxes
-
Set the range of iterations to display. Use the slider or text boxes to specify the first and last iteration to include in both the R-squared tab and Plot tab.
- Number of profiles to display text box
-
Specify how many iterations to display within the range of iterations set using the Iterations to display slider and text boxes. In the R-squared tab, this determines the number of columns displayed in the summary table. In the Plot tab, this determines the number of lines plotted.
- Export Data button
-
Export the data in the table or plot currently displayed in the panel to a CSV file. Opens a file selector to navigate to a location and name the file.
- Save Forcefield Data button
-
Save the force field in your user resources area. A dialog box opens, where you can choose to save as a new force field or merge with an existing force field. If you choose to merge with an existing force field, duplicate parameters are overwritten with the current values from the panel.
- Status bar
-
 to reset the panel to its default settings and clear any data from the panel.
If you can submit a job from the panel, the status bar displays information about the current job settings and status for the panel. The settings include the job name, task name and task settings (if any), number of subjobs (if any) and the host name and job incorporation setting. The job status can include messages about job start, job completion and incorporation.
The status bar also contains the Help button
 , which opens an option menu with choices to open the help topic for the panel (Documentation), launch Maestro Assistant, or if available, choose from an option menu of Tutorials. If the panel is used by one or more tutorials, hover over the Tutorials option to display a list of tutorials. Choosing a tutorial opens the tutorial topic.