Dielectric Function Viewer Panel
Plot the dielectric function from a Quantum ESPRESSO calculation.
To open this panel: click the Tasks button and browse to Materials → Quantum Mechanics → Quantum ESPRESSO → Dielectric Function Viewer.
To open this panel from the entry group for the results of a Quantum ESPRESSO job .
.
The following licenses are required to use this panel: MS Maestro, Quantum Espresso Interface
- Features
- Additional Resources
Dielectric Function Viewer Panel Features
- View results from option menu
-
Choose the structure source for display of the dielectric function.
- Workspace (included entry)—Use the entry that is currently included in the Workspace. Only one entry must be included in the Workspace. When this option is selected, the Import button is displayed.
- File—Use the specified file. When this option is selected, the Browse button is displayed.
- Import button
-
Click Import to load the included entry from the Workspace into the viewer. The name of the included entry is displayed to the right of the button.
- Browse button
-
Click Browse and navigate to the file
- Open New Viewer button
-
Open a new viewer so you can display a different dielectric function.
- Open Viewer for Selected Entries button
-
Select entries in the Entry List or Project Table, then click this button to open a viewer for each entry. This allows you to view plots for related structures and data.
- Direction option menu
-
Specify the Cartesian direction for the plot. If the crystal is not isotropic (cubic), the dielectric function is different in different directions.
- Units option menu
-
Choose the energy units for the horizontal axis of the plot.
- Show legend option
-
Show the legend in the plot. This shows which colors are used for the real and imaginary parts of the dielectric function.
- Plot toolbar
-
The toolbar has tools for manipulating the plot and for saving images. The buttons that are common to all plot toolbars are described in the Plot Toolbar topic.
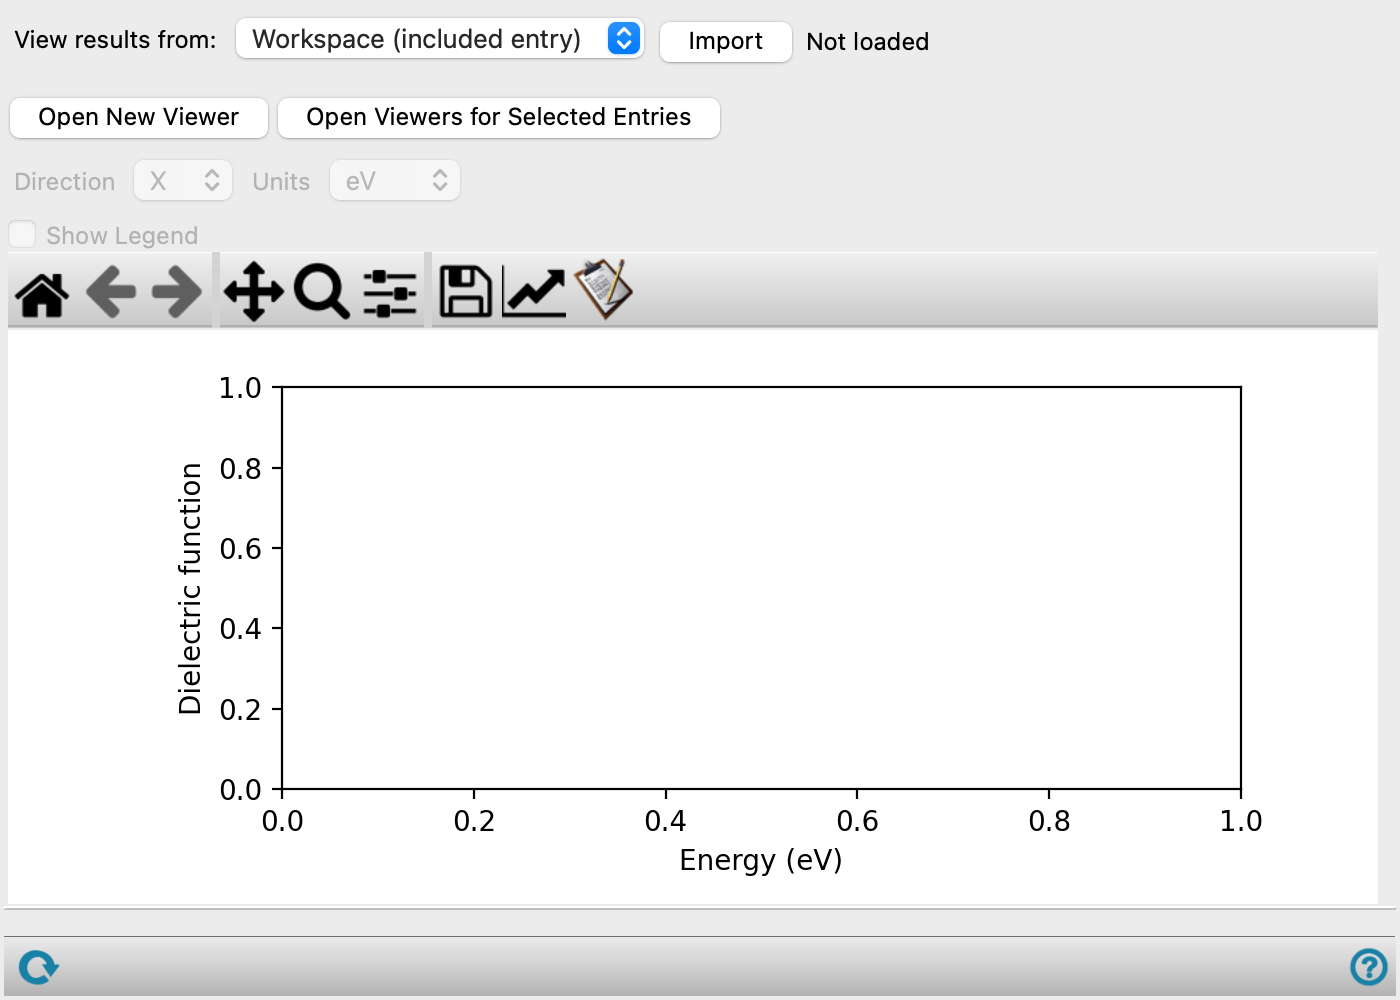
- Plot area
-
This area displays the plot of the real and imaginary parts of the dielectric function as a function of energy. The legend shows which colors are used for the real and imaginary parts.
- Status bar
-
 to reset the panel to its default settings and clear any data from the panel.
If you can submit a job from the panel, the status bar displays information about the current job settings and status for the panel. The settings include the job name, task name and task settings (if any), number of subjobs (if any) and the host name and job incorporation setting. The job status can include messages about job start, job completion and incorporation.
The status bar also contains the Help button
 , which opens an option menu with choices to open the help topic for the panel (Documentation), launch Maestro Assistant, or if available, choose from an option menu of Tutorials. If the panel is used by one or more tutorials, hover over the Tutorials option to display a list of tutorials. Choosing a tutorial opens the tutorial topic.