Electrolyte Analysis Viewer Panel
Display plots of numbers of interactions with ions in electrolyte materials. You can either plot an aggregate distribution of the numbers of coordinated atoms as a histogram, or you can plot the interaction partners of each cation over time.
To open this panel: click the Tasks button and browse to Materials → Classical Mechanics → Trajectory Analysis → Electrolyte Analysis Results.
The following licenses are required to use this panel: MS Maestro
- Features
- Additional Resources
Electrolyte Analysis Viewer Panel Features
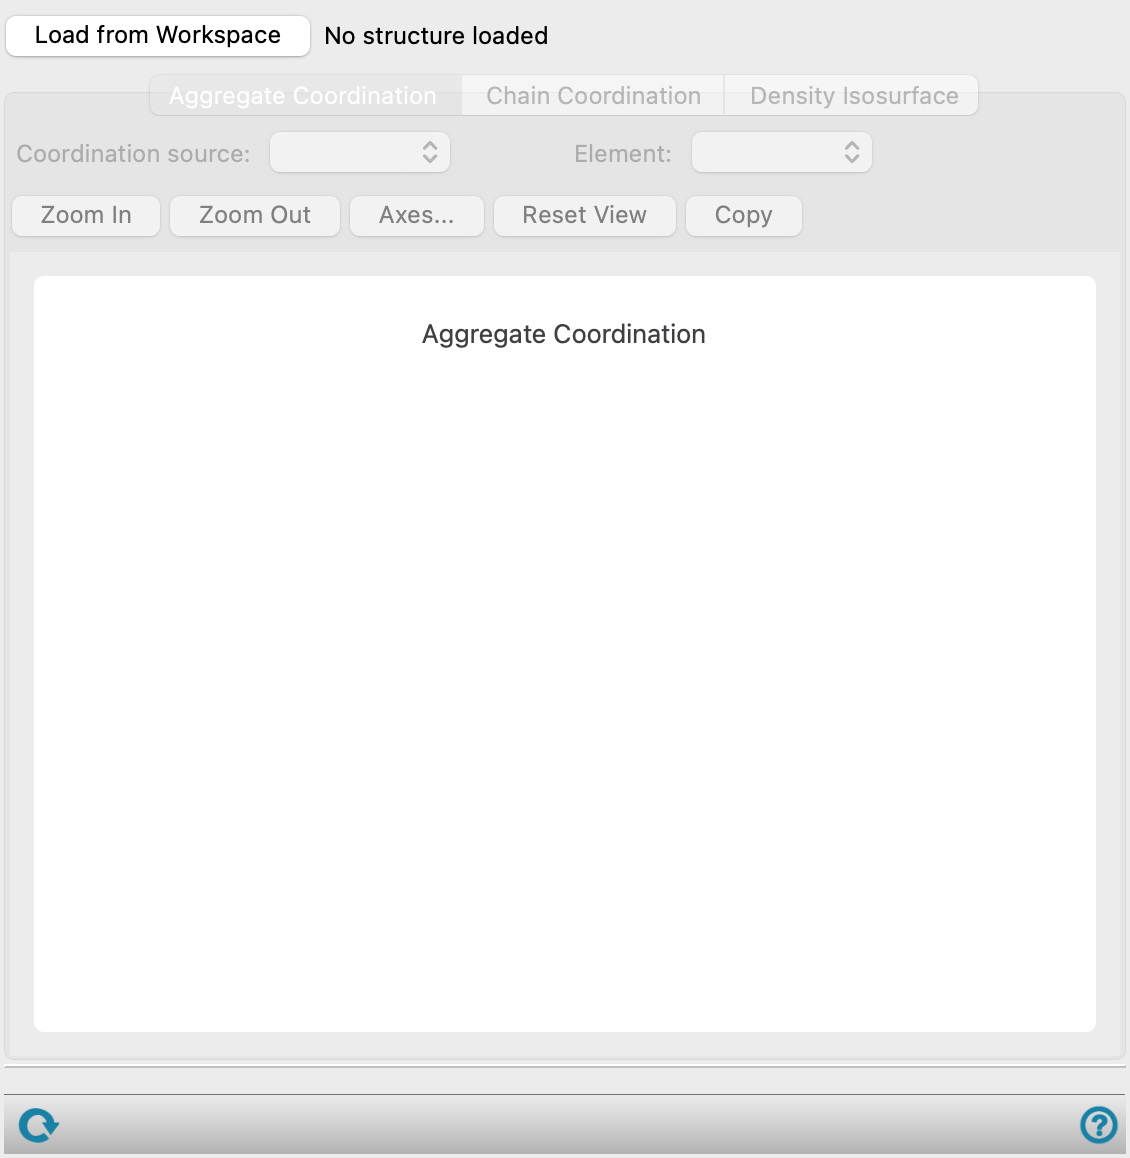
- Load from Workspace button
-
Load the results from the electrolyte analysis calculation for the structure in the Workspace. If the results can’t be located automatically, a dialog opens where you can browse to the results file
jobname_chain_numbers.csv. - Aggregate Coordination tab
-
Show the distribution of numbers of coordinated atoms as a histogram plot.
- Coordination source menu
-
Select the species from which the distribution of coordinated atoms is analyzed, or choose All chains to view the distribution accumulated for all polymer chains, or All molecules to include the counterions as well as the polymer chains.
- Element menu
-
Select an element for which the coordination distribution is analyzed, or choose Any to view the aggregate coordination of all coordinated atoms from the Coordination source.
- Plot buttons
-
Use these buttons to configure the plot.
- Zoom In—Zoom in on the plot. Each click zooms in by a predefined factor, enlarging the view of the current center of the plot. You can also zoom in on a particular area by dragging out a rectangle.
- Zoom Out—Zoom out by a predefined factor. Each click zooms out by a predefined factor, to show more of the plot.
- Axes—Set the range and labeling options for the axes. Opens the Axes Parameters Dialog Box.
- Reset View—Reset the view of the plot to the original zoom and pan values.
- Copy—copy an image of the plot to the clipboard, for use in other applications.
- Update axes ranges option
-
Update the ranges of the axes automatically when the plotted data changes. When this option is not selected, the axis range does not change with changes in the plotted data (choices from the list. Deselecting this option is useful when you set the axis range in the Axes Parameters Dialog Box. This option is reselected when structures are loaded, a different property is plotted or the units change.
- Plot area
-
The frequency of occurrence is plotted against the number of atoms within the coordination cutoff distance as a histogram in this area.
You can zoom in to an area by dragging out a rectangle.
- Chain Coordination tab
-
Show how individual transference ions interact with polymer chains as a function of time.
- Filter text box
-
Filter the Ion atom number list by values that contain the value entered in the text box.
- Ion atom number list
-
Select a transference ion from this list to update plot area with coordination data for the selected ion.
- Plot options
-
Select the type of plot shown in the plot area.
- Chain coordination—display a plot of chain molecule number against simulation time. This plot shows which polymer chains the selected transference ion interacts with during the MD simulation.
- Number of chains—display a plot of number of chains against simulation time. This plot shows how many polymer chains the selected transference ion interacts with during the MD simulation.
- Plot buttons
-
Use these buttons to configure the plot.
- Zoom In—Zoom in on the plot. Each click zooms in by a predefined factor, enlarging the view of the current center of the plot. You can also zoom in on a particular area by dragging out a rectangle.
- Zoom Out—Zoom out by a predefined factor. Each click zooms out by a predefined factor, to show more of the plot.
- Axes—Set the range and labeling options for the axes. Opens the Axes Parameters Dialog Box.
- Reset View—Reset the view of the plot to the original zoom and pan values.
- Copy—copy an image of the plot to the clipboard, for use in other applications.
- Plot area
-
The chain molecule number or number of chains is plotted against the simulation time in this area.
You can zoom in to an area by dragging out a rectangle.
- The plot is updated when the selection in the Ion atom number list is updated.
- Density Isosurface tab
-
This tab displays a density isosurface in the Workspace of the transference ion with respect to the center of mass of the counterion. Only available when the Generate density isosurface option was selected in the Electrolyte Analysis Calculations Panel.
- Transference ion text
-
Displays the transference ion selected in the Electrolyte Analysis Calculations Panel. Noneditable.
- Counterion molecule text
-
Displays the counterion selected in the Electrolyte Analysis Calculations Panel. Noneditable.
- Cutoff distance for ion species text
-
Displays the cutoff distance specified in the Electrolyte Analysis Calculations Panel. Noneditable.
- Resolution text
-
Displays the resolution specified in the Electrolyte Analysis Calculations Panel. Noneditable.
- Surface color button
-
Set the color used for the density isosurface in the Workspace. The current color is displayed on the button.
- Isodensity slider
-
Set the isodensity value for displaying the density isosurface in the Workspace.
- Transparency slider
-
Set the transparency of the isosurface displayed in the Workspace.
- Status bar
-
 to reset the panel to its default settings and clear any data from the panel.
If you can submit a job from the panel, the status bar displays information about the current job settings and status for the panel. The settings include the job name, task name and task settings (if any), number of subjobs (if any) and the host name and job incorporation setting. The job status can include messages about job start, job completion and incorporation.
The status bar also contains the Help button
 , which opens an option menu with choices to open the help topic for the panel (Documentation), launch Maestro Assistant, or if available, choose from an option menu of Tutorials. If the panel is used by one or more tutorials, hover over the Tutorials option to display a list of tutorials. Choosing a tutorial opens the tutorial topic.