Analyze Energetic Disorder Panel
Plot histograms of the variation in site energies and coupling integrals for a selected structure for which these properties have been calculated.
To open this panel: click the Tasks button and browse to Materials → Quantum Mechanics → KMC Charge Mobility → Analyze Energetic Disorder.
The following licenses are required to use this panel: MS Maestro, MS Mobility
- Features
- Additional Resources
Analyze Energetic Disorder Panel Features
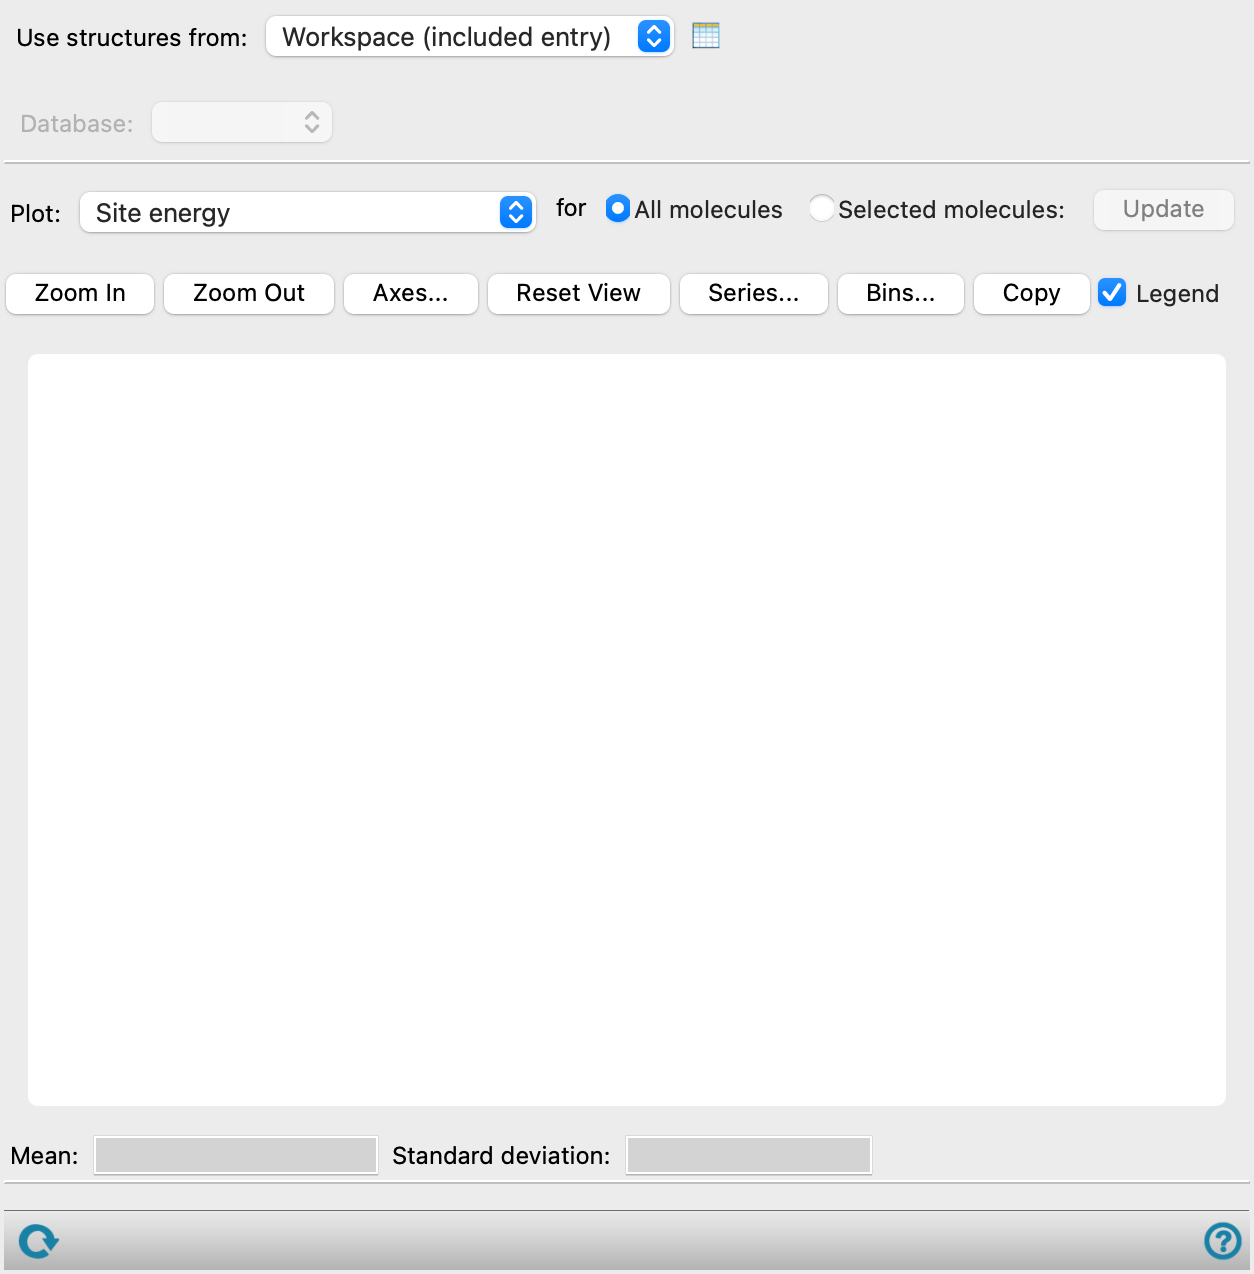
- Use structure from option menu
-
Choose the structure source for the analysis. If the structure source has more than one structure, the first one is used.
- Workspace (included entry)—Use the entry that is currently included in the Workspace. Only one entry must be included in the Workspace.
- File—Use the specified file. When this option is selected, the File name text box and Browse button are displayed.
- Database—Use the structure whose identity is recorded in the specified SQL database. When this option is selected, the File name text box and Browse button are displayed, so you can specify the database.
-
If the source is a database, the structure is located from properties stored in the database: first it is searched for in the Project Table, then at the absolute path to the file retrieved from the database, then in a file in the directory containing the database.
- Open Project Table button
-
Open the Project Table panel, so you can

- File name text box and Browse button
-
Enter the file name in this text box, or click Browse and navigate to the file. The name of the file you selected is displayed in the text box.
- Database option menu
-
Choose the KMC database to use for the analysis. There is a database for each charge type and field. The database locations are recorded in Maestro properties; the given absolute path is tried first, then the directory the structure was imported from.
This menu is not available if you chose Database for the structure source (as the database is already chosen).
- Plot option menu
-
Chose the property to use for the histogram plot.
- Site energy—use the site energy values for each site.
- Coupling integral—use the values of the coupling integral between sites.
- Reorganization energy (hop on)—reorganization energy when a charge hops onto the site: the relaxation energy going from the charged molecule at the neutral geometry to the charged molecule at the charged geometry.
- Reorganization energy (hop off)—reorganization energy when a charge hops off the site: the relaxation energy going from the neutral molecule at the charged geometry to the neutral molecule at the neutral geometry.
- Plot buttons
-
Use these buttons to configure the plot.
- Zoom In—Zoom in on the plot. Each click zooms in by a predefined factor, enlarging the view of the current center of the plot. You can also zoom in on a particular area by dragging out a rectangle.
- Zoom Out—Zoom out by a predefined factor. Each click zooms out by a predefined factor, to show more of the plot.
- Axes—Set the range and labeling options for the axes. Opens the Axes Parameters Dialog Box.
- Reset View—Reset the view of the plot to the original zoom and pan values.
- Series—Set up the appearance of the plot series, such as color, symbol, lines. Opens the Series Parameters Dialog Box.
- Bins—Define the bins used for a histogram plot. Opens the Number of Bins Dialog Box.
- Copy—copy an image of the plot to the clipboard, for use in other applications.
- Legend option
-
Display a legend in the plot.
- Plot area
-
The number of occurrences of the selected plot property in specified ranges is plotted against the property ranges in this area
You can zoom in to an area by dragging out a rectangle.
-
For Site energy and Reorganization energy plots, the occupancy for each energy interval bin is also plotted as a line with a second y-axis to the right. The occupancy for each energy interval is defined as the sum of the occupancies of all molecules with a site energy that falls within that interval.
Clicking on a histogram bar highlights the bar and selects the molecules in the Workspace that contribute values to the histogram bar. You may need to zoom in on the structure to see the selection markers; alternatively you can use the selection to make the molecules more distinct, e.g. by changing the color. You can click multiple bars to select the molecules from all the bars in the Workspace. Clicking a bar again removes the highlight and deselects the molecules in the Workspace. Changing the Workspace selection also removes the highlighting of the bars, as the selection no longer represents the contents of the histogram bars. Likewise, changing the bins clears the highlighting and the selection.
- Mean and Standard deviation text boxes
-
Displays the mean and standard deviation of the plotted values. You can copy the text from these text boxes for use elsewhere.
- Status bar
-
 to reset the panel to its default settings and clear any data from the panel.
If you can submit a job from the panel, the status bar displays information about the current job settings and status for the panel. The settings include the job name, task name and task settings (if any), number of subjobs (if any) and the host name and job incorporation setting. The job status can include messages about job start, job completion and incorporation.
The status bar also contains the Help button
 , which opens an option menu with choices to open the help topic for the panel (Documentation), launch Maestro Assistant, or if available, choose from an option menu of Tutorials. If the panel is used by one or more tutorials, hover over the Tutorials option to display a list of tutorials. Choosing a tutorial opens the tutorial topic.