Optoelectronics Genetic Optimization Viewer Panel
Monitor the progress of a genetic optimization of optoelectronic properties while a job is running, or examine a completed job.
To open this panel, click the Tasks button and browse to Materials → Quantum Mechanics → Optoelectronics → Genetic Optimization Monitoring.
To open this panel from the entry group for the results of a genetic optimization job, use the Workflow Action Menu  .
.
The following licenses are required to use this panel: MS Maestro, GA Optoelectronics
- Using
- Features
- Additional Resources
Using the Optoelectronics Genetic Optimization Viewer Panel
This panel allows you to view the results of a completed genetic optimization job, or to view the progress of a running job. As the jobs can take a long time, it may be useful to examine the results as it is running, for example to assess the progress or success of the optimization, or to make use of structures that meet some criteria before the job finishes.
The panel offers several ways of assessing the progress of the optimization.
-
In the Min/Max Plot tab, you can display the minimum value and the maximum value of any property as a function of the generation. For the scores, if the maximum is not increasing, then the optimization is not making progress. If the maximum is not increasing much and the spread between the maximum and the minimum is increasing, the process is generating structures whose properties are less desirable. You then might want to adjust the parameters to increase the generation of improved structures, or you might want to consider what kinds of mutations you are performing.
-
In the Histogram tab, you can view how many structures had a particular range of values, color coded by generation. From this view you can assess whether the number of structures in the desirable ranges is increasing with each generation.
-
In the Evolution tab, you can view the family tree of any particular individual in any generation. The tree is marked with green lines to the parents and blue lines to the children, and the individuals are colored by a property value. This allows you to see how the property value is changing between generations. The properties of the family (parents, individual, children) are shown in the Structure Window so you can examine all the properties, not just the one used for coloring.
Optoelectronics Genetic Optimization Viewer Panel Features
Job loading buttons
These buttons can be used to load the current results for a job or to refresh the results for an already loaded job.
When you click Load New Job a panel opens so you can select the job. You can either select Load from job database, then select a job from the table of jobs, or you can select Manually locate GA directory and click Browse to open a directory selector and navigate to a directory that contains the job results. This allows you to examine a job for which the job record no longer exists in the job database.
Clicking Refresh Current Job updates the results for the job that is loaded. This action is only effective if the job is still running.
Show structure window
Select this option to show the Structure Window, which displays 2D structures together with scores and property values, arranged in a grid. You can set the number of columns in the grid, and display the structures from each generation in a separate row. You can select multiple structures, and either incorporate them into the project or remove them from the structure window. Structures are not incorporated again if they have already been incorporated.
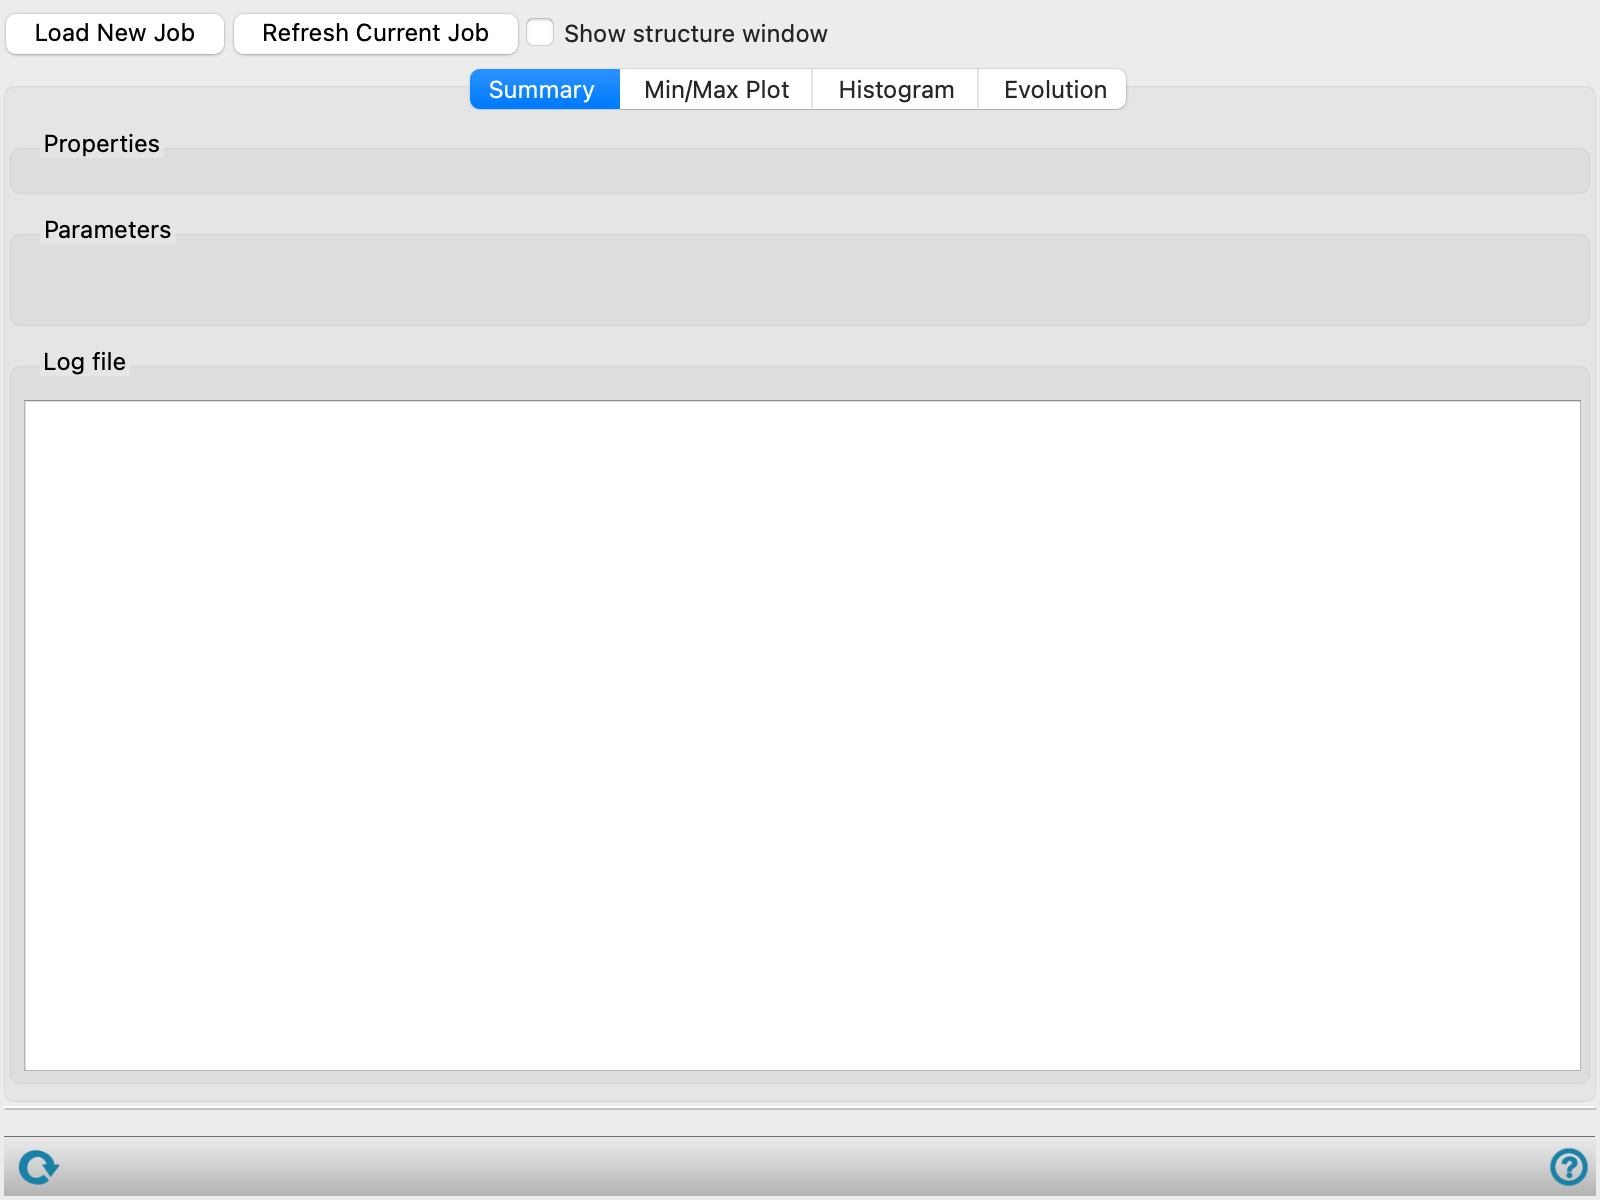
Summary tab
This tab provides a summary of the job, including settings and output.
- Properties section
-
This section lists the properties chosen for optimization and the criteria for optimizing the properties (the values in the Property table of the Genetic Algorithm panel).
- Parameters section
-
This section lists the parameters set for the genetic algorithm in the Genetic Algorithm panel.
- Log file section
-
This section lists the contents of the log file for the job.
Min/Max Plot tab
In this tab, statistics of a property are plotted against the generation number.
- Property option menu
-
Choose the property to display in the plot area from this option menu.
- Statistics options
-
Select the statistics to plot. You can plot the minimum value observed for each generation, the maximum value, the average value, the standard deviation, and the target value, if a target is defined. If you select both the minimum and the maximum, the area between the lines is colored light green, to highlight the range of values observed.
- Plot toolbar
-
The toolbar has tools for manipulating the plot and for saving images. The buttons that are common to all plot toolbars are described in the Plot Toolbar topic.
- Plot area
-
The statistics for the property are displayed in this area. Pausing the pointer over a point displays the 2D structure and property values for that structure; the points (circles) are only plotted for the minimum and maximum. Clicking (or right-clicking) on a point displays a menu that allows you to add the structure to the Structure Window, incorporate the structure into the project, or incorporate all structures into the project.
Histogram tab
Display a histogram showing the number of structures found as a function of the chosen property value.
- Property option menu
-
Choose the property for the histogram display from this option menu.
- Number of bins slider
-
Specify the number of bins for the property value to use for the histogram. The property range is divided equally between the bins.
- Plot toolbar
-
The toolbar has tools for manipulating the plot and for saving images. The buttons are common to all plot toolbars, and are described in the Plot Toolbar topic.
- Plot area
-
This area displays the histogram. Each bar in the histogram is partitioned into regions by generation and color-coded according to the legend on the left. Pausing the pointer over a region shows information on the properties for the generation represented in that region of the bar. If there are fewer than 4 structures represented, information on all properties for each structure is shown, including the 2D structure. If there are 4 or more structures represented, the ranges of all properties are shown.
If you click on a region, a menu is shown, which allows you to show the structures from that generation and bin (the region) or the structures from the entire bin (the bar); and to incorporate structures into the project from the generation and bin, the entire bin, or the entire set of structures.
Evolution tab
Show the evolutionary history of the structures, with color coding of the structures according to the chosen property value. This allows you to see how the mutations affected the property value.
- Property option menu
-
Choose a property for color coding from this option menu.
- Resize with panel option
-
Resize the display so that the entire display fits in the panel area. This is done by simple scaling of the display (without regard to aspect ratio).
- Color map option menu
-
Choose the color map for color coding the property values for each structure.
- Display area
-
Each generation is shown as a horizontal bar, partitioned into rectangles for each individual. The rectangles are color coded by the property value. The tooltip for a rectangle shows the 2D structure and all of the properties.
Clicking a rectangle displays a green line connecting the individual to the parent (for mutation) or parents (for crossover), and a blue line connecting the individual to its children. It also adds all of these structures to the Structure Window. Shift-clicking on any of the parent or children rectangles extends the family tree to the previous or next generation from that individual.
Right-clicking in a rectangle displays a menu, which you can use to show the structure in the Structure Window, incorporate the structure, the generation, or all structures into the project, or clear the family tree display.
Status bar
 to reset the panel to its default settings and clear any data from the panel.
If you can submit a job from the panel, the status bar displays information about the current job settings and status for the panel. The settings include the job name, task name and task settings (if any), number of subjobs (if any) and the host name and job incorporation setting. The job status can include messages about job start, job completion and incorporation.
The status bar also contains the Help button  , which opens an option menu with choices to open the help topic for the panel (Documentation), launch Maestro Assistant, or if available, choose from an option menu of Tutorials. If the panel is used by one or more tutorials, hover over the Tutorials option to display a list of tutorials. Choosing a tutorial opens the tutorial topic.