ESM: Density/Potential Profile Panel
Display a plot of the charge density and the potential along the Z-axis through a slab, as evaluated from an effective screening medium (ESM) periodic DFT calculation.
To open this panel, click the Tasks button and browse to Materials → Quantum Mechanics → Quantum ESPRESSO → ESM: Density/Potential Profile.
The following licenses are required to use this panel: MS Maestro, Quantum Espresso Interface
- Features
- Additional Resources
ESM: Density/Potential Profile Panel Features
- Use structures from option menu
- Open Project Table button
- File name text box and Browse button
- Open New Viewer button
- Open Viewers for Selected Entries button
- Informational text boxes
- Fermi level text box
- Show legend option
- Plot options options
- Difference plot option and menu
- Plot toolbar
- Plot area
- Work function text box
- Status bar
- Use structures from option menu
-
Choose the structure source for the current task.
- Project Table (n selected entries)—Use the entries that are currently selected in the Project Table or Entry List. The number of entries selected is shown on the menu item.
- Workspace (included entry)—Use the entry that is currently included in the Workspace. Only one entry must be included in the Workspace.
- File—Use the specified file. When this option is selected, the File name text box and Browse button are displayed.
- Project Table (n selected entries)—Use the entries that are currently selected in the Project Table or Entry List. The number of entries selected is shown on the menu item.
- Open Project Table button
-
Open the Project Table panel, so you can

- File name text box and Browse button
-
Enter the file name in this text box, or click Browse and navigate to the file. The name of the file you selected is displayed in the text box.
- Open New Viewer button
-
Open a new viewer so you can display a different set of results. This is useful for comparing results.
- Open Viewers for Selected Entries button
-
Select entries in the Entry List or Project Table, then click this button to open a viewer for each entry. This allows you to view plots for related structures and data. The new viewers do not have controls for the structure source. This button is only available if you choose Project Table for Use structures from.
- Informational text boxes
-
These noneditable text boxes give information on the system: the ESM system type, the electric field, and the total charge. You can copy the values from the text boxes for pasting.
- Fermi level text box
-
The default value of the Fermi level from the ESM calculation is shown in eV. Changing the value updates the Fermi level line in the plot and the Work function text box.
- Show legend option
-
Display the legend for the plot to the right of the plot.
- Plot options options
-
Select the plot type to display:
-
Both—plot both the charge density (in blue) and the potential (in red). The charge density scale is shown on the left axis, the potential scale is shown on the right axis.
-
Charge density—plot only the charge density.
-
Potential—plot only the potential.
-
- Difference plot option and menu
-
Plot the difference in charge density or potential relative to the entry selected from the option menu. This option allows you to examine changes in these quantities when the differences are small and are not discernible when the value of the property is plotted. The option menu lists the entries that are currently selected in the Project Table.
- Plot toolbar
-
The toolbar has tools for manipulating the plot and for saving images. The buttons that are common to all plot toolbars are described in the Plot Toolbar topic.
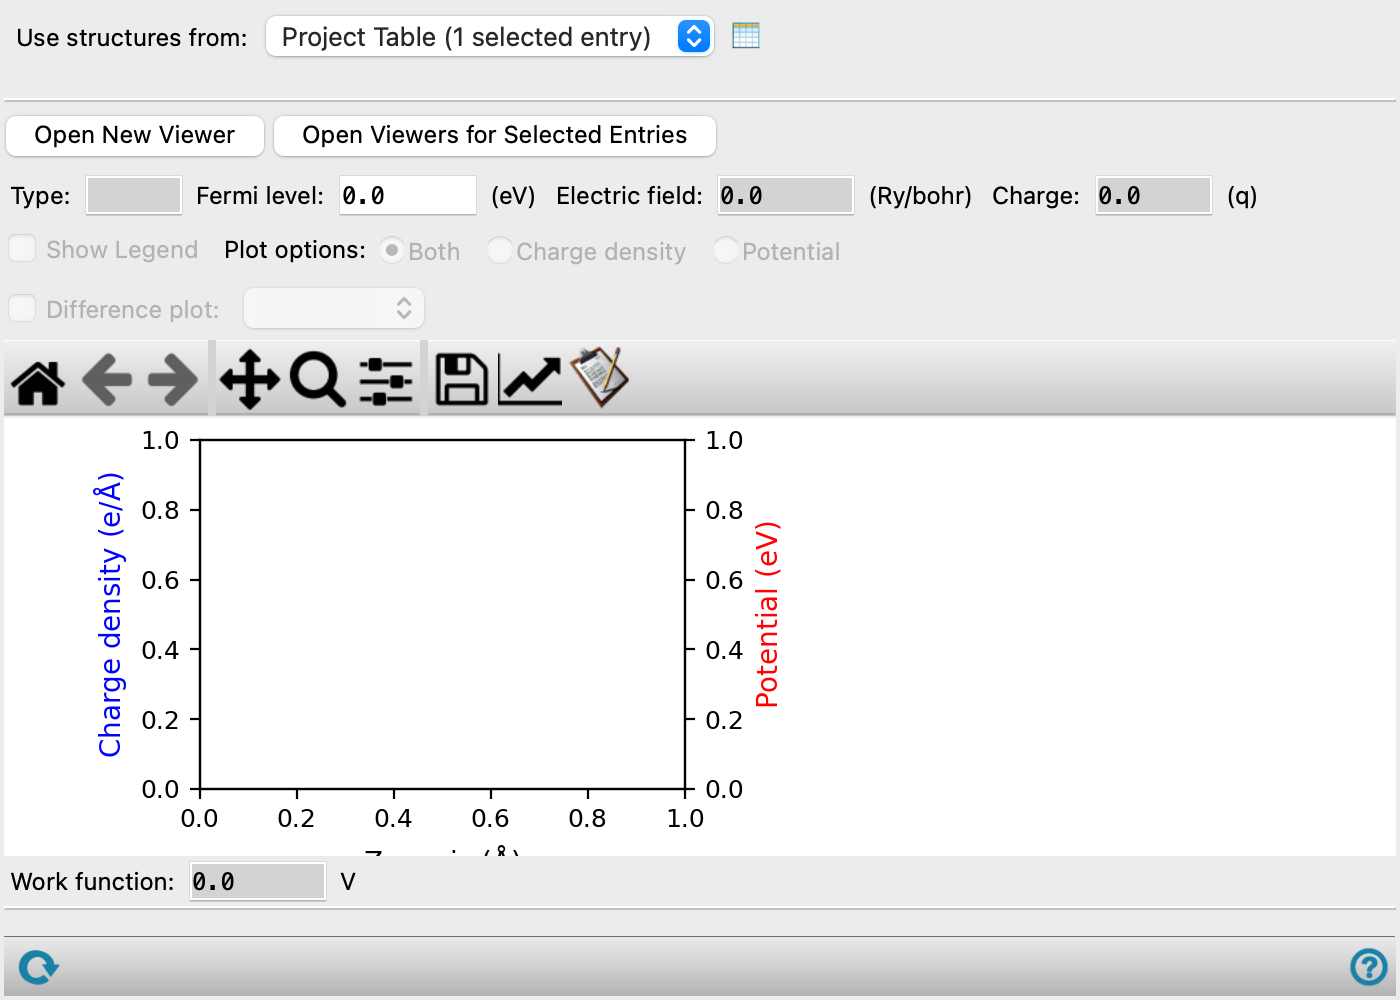
- Plot area
-
The plot of the charge density and the potential are displayed in this area. The values are evaluated as averages (integrals) over x and y for each z point.
The vertical axis labels are colored with the color of the plot line.
- Work function text box
-
This noneditable text box displays the value of the work function (potential minus Fermi level) at the point in the plot where the cursor is positioned.
- Status bar
-
 to reset the panel to its default settings and clear any data from the panel.
If you can submit a job from the panel, the status bar displays information about the current job settings and status for the panel. The settings include the job name, task name and task settings (if any), number of subjobs (if any) and the host name and job incorporation setting. The job status can include messages about job start, job completion and incorporation.
The status bar also contains the Help button
 , which opens an option menu with choices to open the help topic for the panel (Documentation), launch Maestro Assistant, or if available, choose from an option menu of Tutorials. If the panel is used by one or more tutorials, hover over the Tutorials option to display a list of tutorials. Choosing a tutorial opens the tutorial topic.