Phase Diagram Viewer Panel
Plot the compositional phase diagram to understand the relative stability of compounds with respect to their composition.
To display this panel: click the Tasks button and browse to Materials → Quantum Mechanics → Quantum ESPRESSO → Phase Diagram Viewer
The following licenses are required to use this panel: MS Maestro
- Features
- Additional Resources
Phase Diagram Viewer Panel Features
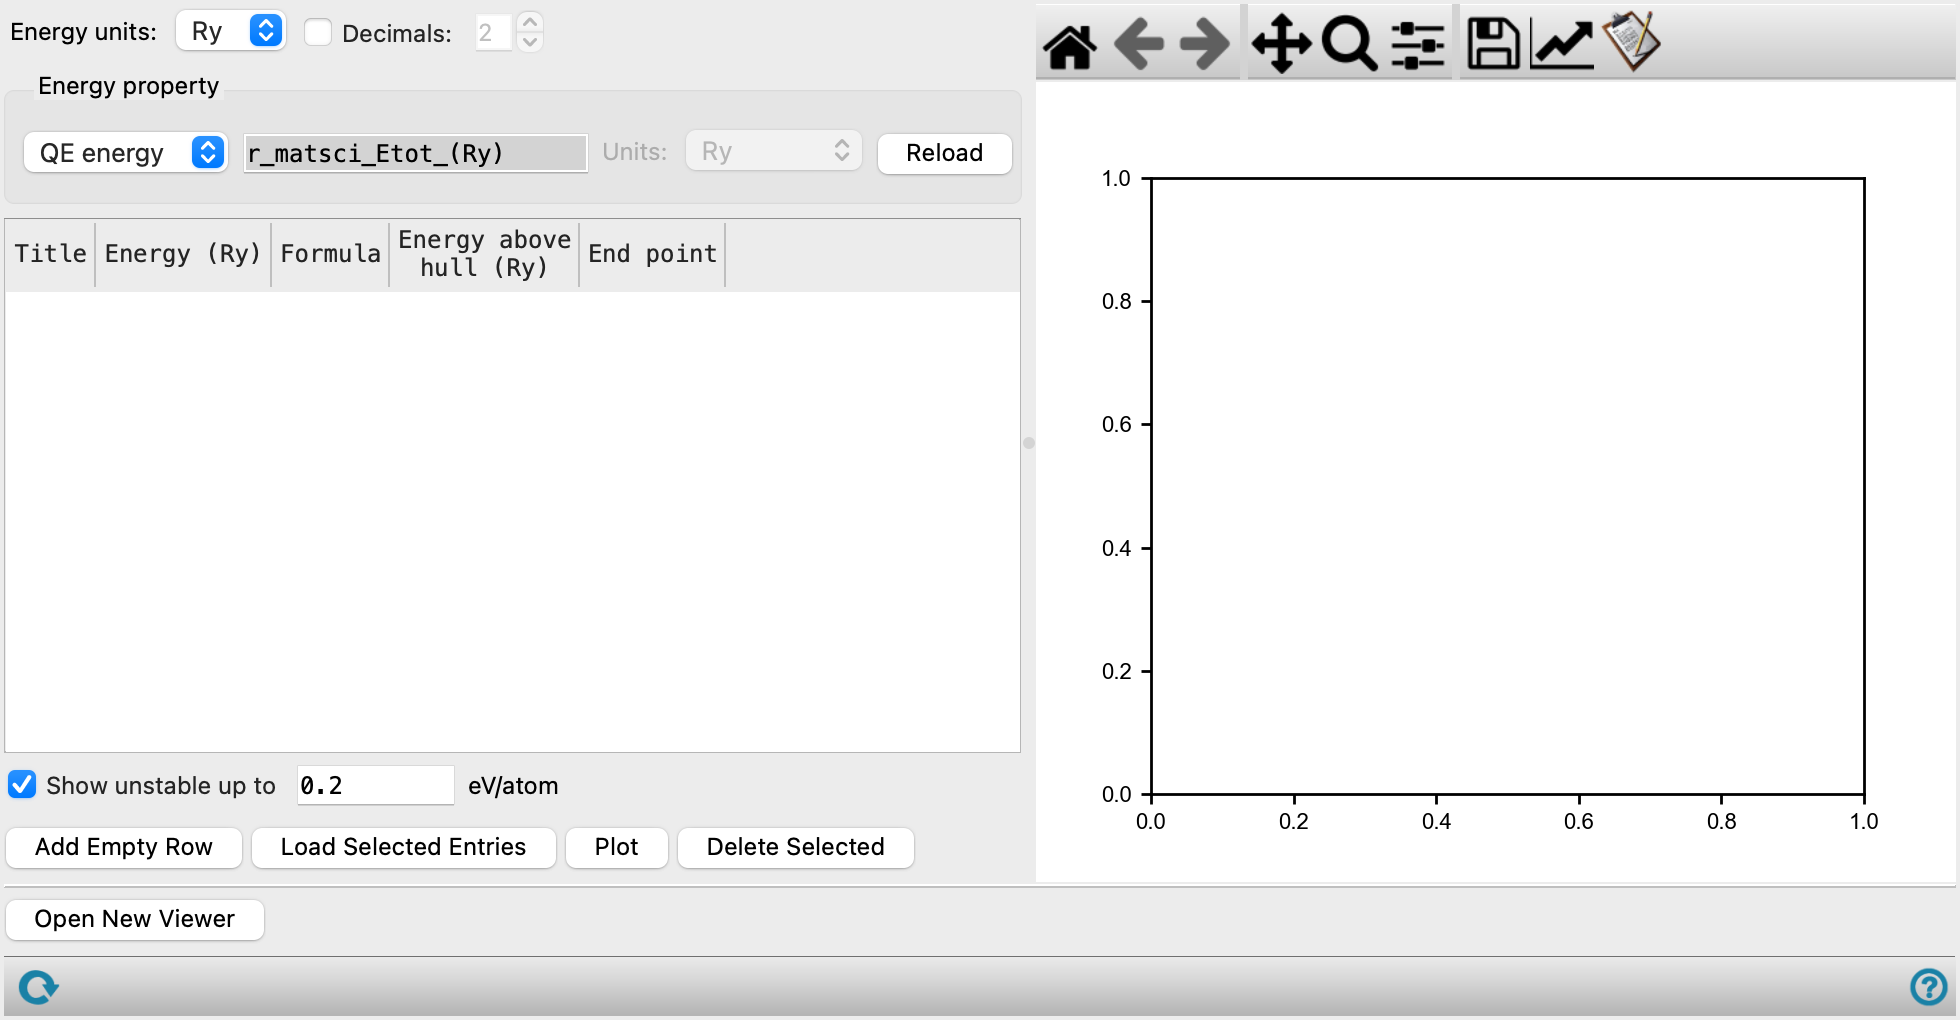
- Energy units option menu
-
Select between the electron volts (eV) and rydberg (Ry) energy units for the energies displayed in the phase diagram table.
- Decimals option and text box
-
Optionally, limit the number of decimal places displayed for the Energy and Energy above hull values in the phase diagram table.
- Energy property section
-
- Energy option menu and text box
-
Select between QE energy and Custom for the energy property. For QE energy, the r_matsci_Etot_(Ry) property must exist in the entries that are imported from the Project Table. Calculate the QE energy of the structures using the Quantum ESPRESSO Calculations Panel or add a Custom energy property using values from The Materials Project or literature. The Etot energy loaded into the panel refers to the total energy of each calculated system. For Custom, energy values can be manually defined in the table or can be imported from a pre-defined property specified in the text box.
- Units option menu
-
Specify the units of the custom energy values provided. The custom values are converted when plotting the phase diagram and calculating the Energy above hull. Only available when Custom is chosen as the Energy property.
- Reload button
-
Reload the Energy of the structures loaded in the phase diagram table according to the parameters selected in the Energy property section.
- Phase diagram table
-
Load all compounds of interest to generate the relevant compositional phase diagram. The elemental compositions and the energies of the compounds are used to plot the phase diagram and calculate the energies above the hull. Editing is only available for manually added empty rows and Custom energy values. Double-click on any cell to edit its value.
-
Title—Displays the name of the structure from the Project Table.
-
Energy (N)— Displays the energy of the structure in the selected Energy units denoted here as N.
-
Formula—Empirical formula of the structure represented by a row, determined from the elemental composition of the structure.
-
Energy above hull (N)—The energy difference of the structure and its corresponding lowest energy system on the convex hull, in the selected Energy units denoted here as N. This value is updated after clicking Plot. If the value cannot be calculated, this row is highlighted in red.
-
End Point—Define structures as endpoints on the compositional axis. This value is updated after clicking Plot.
Select rows in the table to display a legend with the chemical composition of the structure in the plot area.
-
- Show unstable up to N option and text box
-
Plot unstable phases that have energies above the hull that are lower than or equal to the value specified, in eV/atom. The larger the energy above the convex hull - the less stable the system.
Click the Plot button after adjusting this value to update the plot area. These structures are shown in the plot as red squares.
- Add Empty Row button
-
Add a row to the table. The added row is empty, and you can manually define the structure and its properties.
- Load Selected Entries button
-
Import each of the entries that are selected in the Project Table as a new row.
- Plot button
-
Update the plot with the current structures and options.
- Delete Selected button
-
Delete the selected row(s) in the table.
- Plot toolbar
-
The toolbar has tools for manipulating the plot and for saving images. The buttons that are common to all plot toolbars are described in the Plot Toolbar topic.
- Plot area
-
Plot the predicted convex hull for the given structures represented as a thick black line. Green circles show stable compounds which lie on the convex hull while red squares show unstable compounds with energies above the convex hull. The larger the energy above the convex hull, the less stable the system.
Click any row in the table to display its chemical composition in the plot. Alternatively, click on any data point in the plot to display its chemical composition and highlight the corresponding row.
- Open New Viewer button
-
Open a new viewer so you can display a different phase diagram.
- Status bar
-
 to reset the panel to its default settings and clear any data from the panel.
If you can submit a job from the panel, the status bar displays information about the current job settings and status for the panel. The settings include the job name, task name and task settings (if any), number of subjobs (if any) and the host name and job incorporation setting. The job status can include messages about job start, job completion and incorporation.
The status bar also contains the Help button
 , which opens an option menu with choices to open the help topic for the panel (Documentation), launch Maestro Assistant, or if available, choose from an option menu of Tutorials. If the panel is used by one or more tutorials, hover over the Tutorials option to display a list of tutorials. Choosing a tutorial opens the tutorial topic.