Polymer Chain Analysis Viewer Panel
Show time series and histogram plots of polymer properties, including end-to-end distance from a persistence length calculation, radius of gyration, and orientational order parameters.
To open this panel: click the Tasks button and browse to Materials → Classical Mechanics → Trajectory Analysis → Polymer Chain Analysis Results.
To open this panel from the entry group for the results of a polymer chain analysis job .
.
The following licenses are required to use this panel: MS Maestro
- Using
- Features
- Additional Resources
Using the Polymer Chain Analysis Viewer Panel
In this panel, you can analyze persistence length data, radius of gyration data, and orientational order parameters, and determine the range of the trajectory over which you want various overall properties to be calculated. You might want to do this to ensure that it is evaluated over the part of the trajectory where the system is equilibrated, for example. The range is set either by dragging the slider bars on the time series plot, or setting the start time and end time in the text boxes. The histogram plot is updated to show the distribution of values from the restricted time range. You can save the calculated or derived properties along with the time range as project properties for the structure, and export the data from the time series and histogram plots to CSV files.
Polymer Chain Analysis Viewer Panel Features
- Load Data from Workspace button
-
Read in the persistence length data for the structure in the Workspace.
- Plot toolbar
-
The toolbar has tools for manipulating the plot and for saving images. The buttons that are common to all plot toolbars are described in the Plot Toolbar topic.
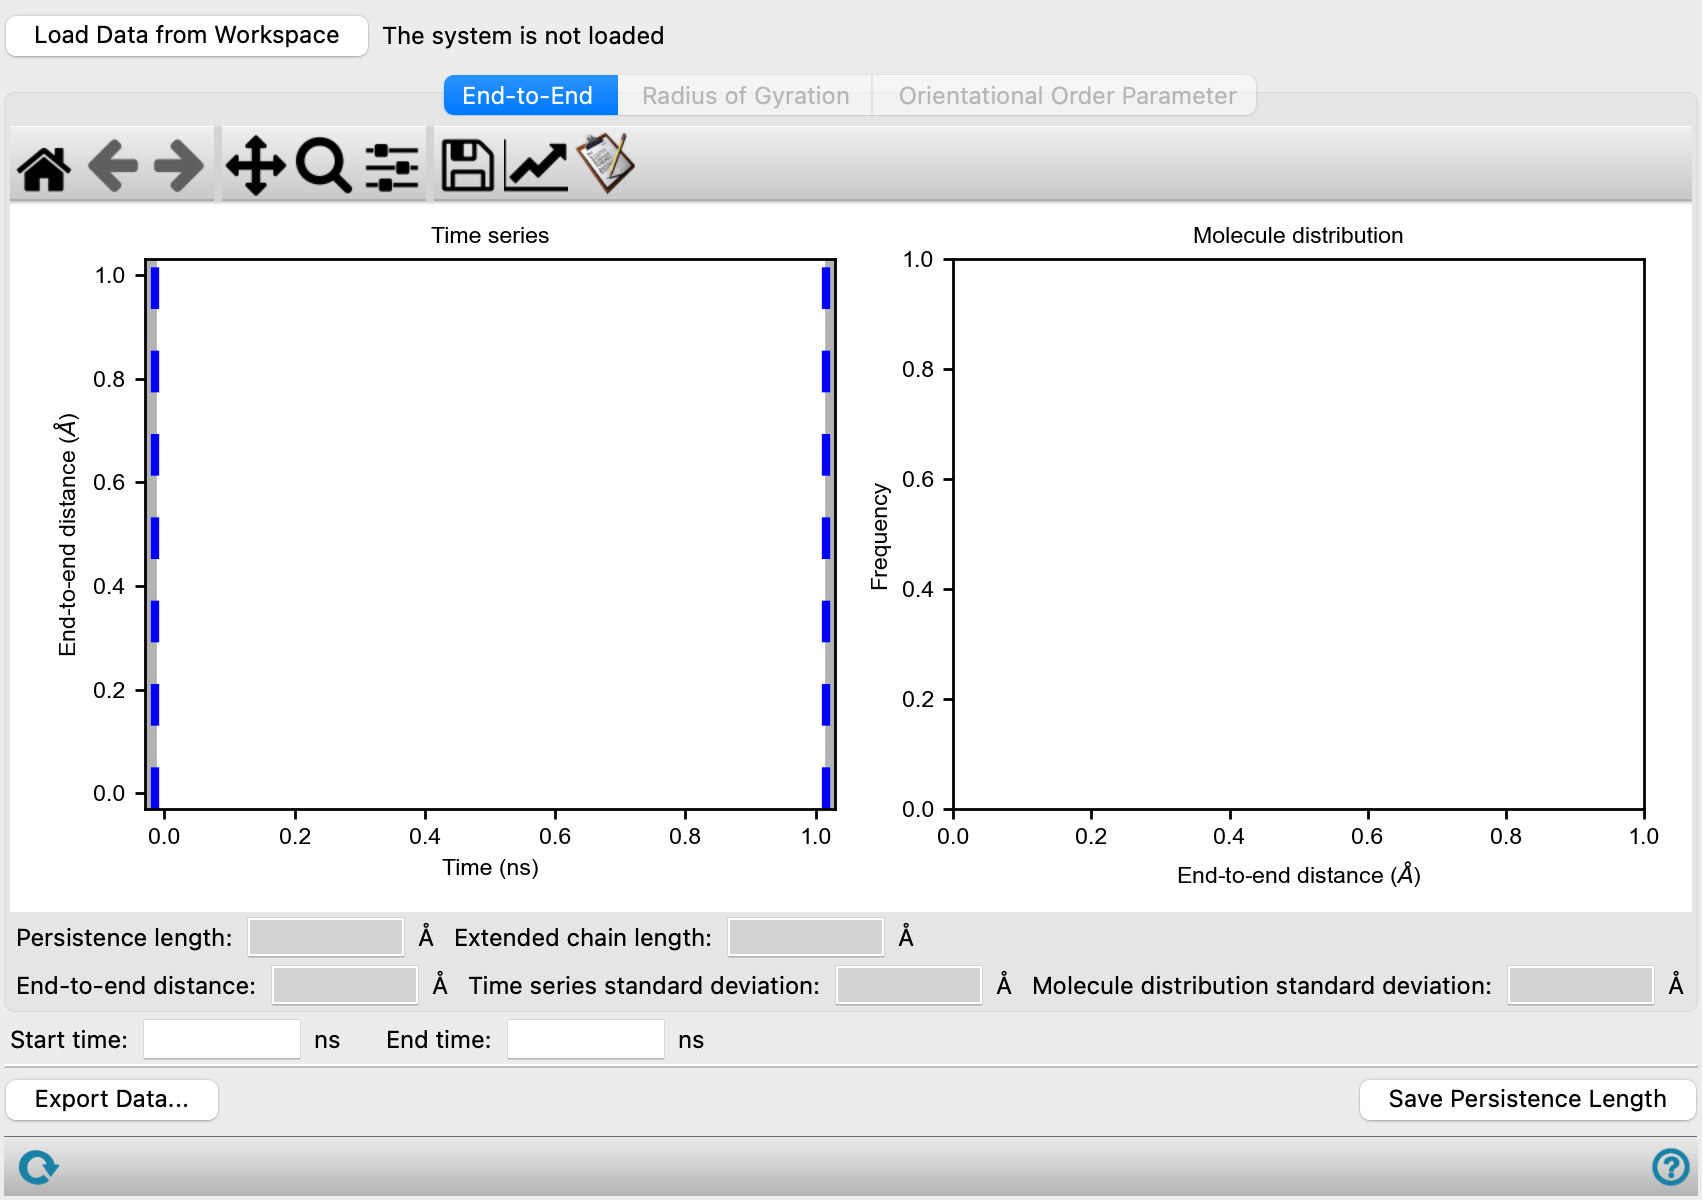
- End-to-End tab
-
Display analysis of end-to-end distances and values derived from the data.
- Time series plot
-
The time series plot shows the mean end-to-end distance for each time step as a function of simulation time. There are two vertical slider bars, one on each side of the plot, which can be used to set the start and end time used for the calculation of the persistence length. When you drag the sliders, the time in the Start time and End time text boxes is updated to reflect the slider position. The persistence length is calculated over the restricted time range, and the histogram plot is updated to show the distribution of end-to-end distances in the restricted time range.
- Molecule distribution plot
-
This plot shows a histogram of the mean end-to-end distances in the restricted time range from the time series plot. The mean end-to-end distances over all molecules and time steps (as plotted on the Time series plot) are divided between 10 bins. The plot is updated as you adjust the start and end time.
- Internal distances plot
-
This plot shows the mean square internal distance (⟨R2⟩/N) as a function of the number of bonds in the chain segment for which the distance is calculated (N). The points in the plot can be selected; the selected point is marked with a larger black dot. Selecting a point changes the plots to display information for internal distances of chain segments of length specified by the point selected. The number of bonds in the segment is updated in the Plot internal distances for N-bond segments text box when you select a point. The rightmost point in the plot corresponds to the full chain length, so selecting it shows end-to-end distance plots.
This plot is only present if calculation of internal distances is selected in the Polymer Chain Analysis Panel.
- Property text boxes
-
These noneditable text boxes report the values of the following properties:
- Persistence length—calculated from the data between the start time and the end time of the end-to-end distance vs time plot.
- Extended chain length—value obtained from the input.
- End-to-end distance or Internal distance of N-bond segments—mean value over the specified time range.
- Time series standard deviation—of the distance fit for the time series over the specified time range.
- Molecule distribution standard deviation—of the distance fit for the molecule distribution over the specified time range.
- Plot internal distances for N-bond segments text box
-
Plot internal distances for chain segments of the specified number of bonds in length. The allowed values are determined by the step set in the Polymer Chain Analysis Panel; if a different value is entered, it is changed to the nearest allowed value. This text box is updated when you select a point on the Internal distances plot, to display the value for the selected point.
- Radius of Gyration tab
-
Display analysis of the radius of gyration and related data. This tab is only present if calculation of the radius of gyration was selected in the Polymer Chain Analysis Panel.
- Time series plot
-
The time series plot shows the quantity selected from the Plot options as a function of simulation time. There are two vertical slider bars, one on each side of the plot, which can be used to set the start and end time used for the calculation of the plotted quantity. When you drag the sliders, the time in the Start time and End time text boxes is updated to reflect the slider position. The mean and mean squared radius of gyration are calculated over the restricted time range, and the histogram plot is updated to show the distribution of values in the restricted time range.
- Molecule distribution plot
-
This plot shows a histogram of the values of the selected quantity to plot, taken for all molecules and all time steps in the restricted time range from the time series plot, divided between 10 bins. It is updated as you adjust the start and end time.
- Plot options
-
Choose the quantity to plot in the time series and molecule distribution:
- Radius of gyration—mean value of the radius of gyration in Å over all chains at a particular time
- Squared radius of gyration—mean squared value of the radius of gyration in Å2 over all chains at a particular time
- Chain fractional anisotropy—mean fractional anisotropy of the inertia tensor for each chain at a particular time
- Property text boxes
-
These noneditable text boxes report the values of the following properties, which are calculated as the mean and standard deviation over all trajectory frames between the start time and the end time of the Time series plot.
- Mean radius of gyration and Standard deviation
- Mean squared radius of gyration and Standard deviation
- Fractional anisotropy and Standard deviation
- Orientational Order Parameter tab
-
Display analysis of the principal axis orientational order parameters. This tab is only present if calculation of the principal axis orientational order parameters was selected in the Polymer Chain Analysis Panel.
- Time series plot
-
The time series plot shows the mean value of the chosen orientational order parameter as a function of simulation time. There are two vertical slider bars, one on each side of the plot, which can be used to set the start and end time used for the calculation of the mean orientational order parameter. When you drag the sliders, the time in the Start time and End time text boxes is updated to reflect the slider position. The mean orientational order parameter is calculated over the restricted time range.
- Molecule distribution plot
-
This plot shows a histogram of the values of the selected quantity to plot, taken for all molecules and all time steps in the restricted time range from the time series plot, divided between 10 bins. It is updated as you adjust the start and end time.
- Plot time series options
-
Choose the orientational order parameter to plot in the time series and molecule distribution plots. The orientational order parameters are average values of the Legendre polynomials, P2, P4, and P6, and are labeled after the polynomial.
- Color molecules by Pn button
-
Color the molecules in the Workspace by the values of the orientational order parameter for each molecule in the final frame of the trajectory. This allows you to visually examine the spatial distribution of order parameters. The colors range from green for parallel alignment, through yellow for unaligned molecules, to red for perpendicular alignment. The orientational order parameter for a molecule represents its alignment with all other molecules.
- Property text boxes
-
These noneditable text boxes report the mean and standard deviation of the orientational order parameters, which are calculated over all trajectory frames between the start time and the end time of the Time series plot.
- Start time and End time text boxes
-
Specify the simulation start time and end time to limit the range of times over which the persistence length is evaluated. These text boxes are linked to the slider bars in the Time series plot.
- Export Data button
-
Export time series data and histogram data to a CSV file, and the internal distance data, if present. Opens a file selector for each set of data. The data exported is the data displayed in the plots, whether for end-to-end distances, internal distances, or radius of gyration.
- Save Persistence Length button
-
Save the calculated persistence length, mean end-to-end distance and squared end-to-end distance, and the start and end times to the project entry as the properties Persistence Length (Ang.), End-to-end Distance (Ang.), Mean Squared End Distance (Ang.^2), End Dist Time Start (ns), End Dist Time End (ns).
- Status bar
-
 to reset the panel to its default settings and clear any data from the panel.
If you can submit a job from the panel, the status bar displays information about the current job settings and status for the panel. The settings include the job name, task name and task settings (if any), number of subjobs (if any) and the host name and job incorporation setting. The job status can include messages about job start, job completion and incorporation.
The status bar also contains the Help button
 , which opens an option menu with choices to open the help topic for the panel (Documentation), launch Maestro Assistant, or if available, choose from an option menu of Tutorials. If the panel is used by one or more tutorials, hover over the Tutorials option to display a list of tutorials. Choosing a tutorial opens the tutorial topic.