Stress Strain Viewer Panel
Display plots of the stress or the residual strain against the strain from a stress-strain calculation. For stress vs strain, you can perform a convex analysis of the data; for residual strain you can fit the residual strain to find the yield strain, and perform an uncertainty quantification for the yield strain.
To open this panel: click the Tasks button and browse to Materials → Classical Mechanics → Stress Strain → Stress Strain Results.
To open this panel from the entry group for the results of a stress strain job .
.
The following licenses are required to use this panel: MS Maestro
- Features
- Additional Resources
Stress Strain Viewer Panel Features
- Load Data from Workspace button
- Load Averaged Data from Selected Entries button
- Main axis option menu
- Stress type option menu
- Stress component option menu
- Strain component option menu
- Remove first data point option
- General tab
- Convex analysis tab
- Residual strain fit tab
- Yield strain uncertainty tab
- Export Data button
- Status bar
- Load Data from Workspace button
-
Load the stress-strain data from the Workspace structure, which must contain the output structure from a stress-strain calculation.
- Load Averaged Data from Selected Entries button
-
Load aggregated results from multiple stress-strain simulations on the same system, from the selected entries in the project. Before loading, you should import all the simulation results and select the corresponding entries. The contents of the Workspace are ignored. In the plots, the standard deviation over the multiple replicates is indicated by a shaded area around the plot line. The exact value for the standard deviation is shown at the top right of the plot area when you pause the pointer over a data point.
For disordered systems such as polymers, it is useful to average over multiple replicates to capture variance in properties from the specific architecture in the simulation cell.
- Main axis option menu
-
Select the crystal axis along which the strain was applied as the main axis. Average means use the average stress and strain over the three axes for the specified stress type. The effective stress and strain or normal stress and strain are calculated for each of the three axes, then averaged.
- Stress type option menu
-
Choose the type of stress to plot.
-
Effective—plot the effective stress, defined as σ = √[((σ1-σ2)2 + (σ2-σ3)2 + (σ3-σ1)2)/6]. This is related to the von Mises stress by a factor of 1/√3.
-
Normal—plot the raw or unmodified stress.
-
- Stress component option menu
-
Choose the direction of the tensor component of the stress to plot on the vertical axis. Only available if you choose Normal from the Stress type option menu.
- Strain component option menu
-
Choose the component of the strain to plot on the horizontal axis, from Normal or Transverse when plotting the normal stress, and Effective when plotting the effective stress. The effective strain is defined as defined as ε = √[((ε1-ε2)2 + (ε2-ε3)2 + (ε3-ε1)2)/6]. This is related to the von Mises strain by a factor of 1/√3.
- Remove first data point option
-
Remove the first data point from the plot. There is often a discontinuity at the first point, which should be removed for calculation of the elastic modulus.
- Plot toolbar
-
The toolbar has tools for manipulating the plot and for saving images. The buttons that are common to all plot toolbars are described in the Plot Toolbar topic.
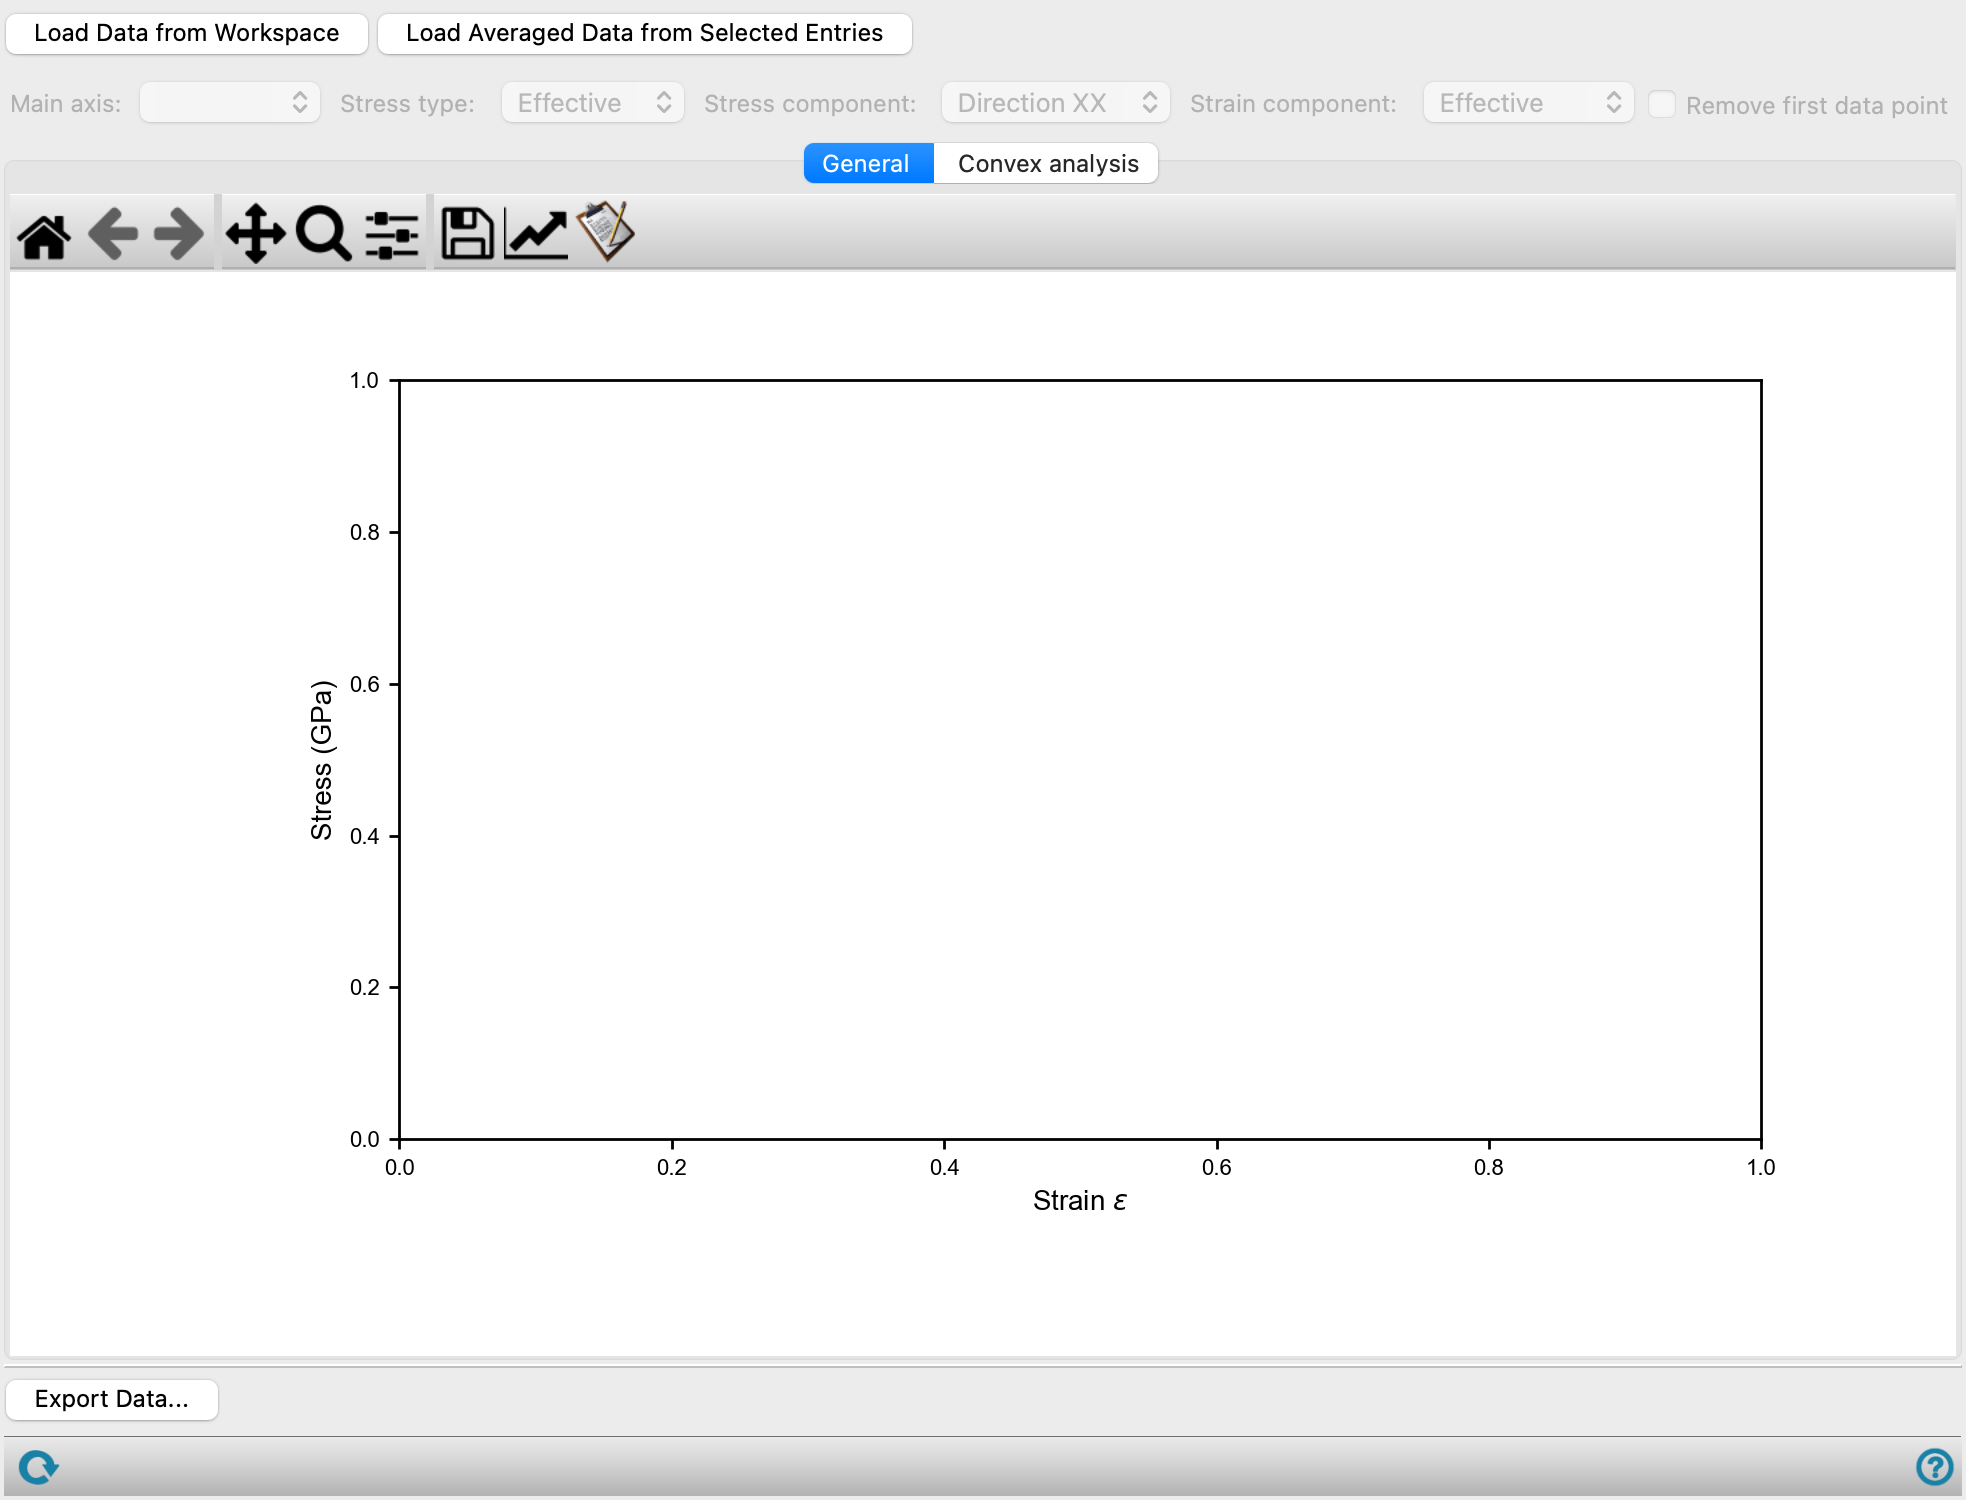
- General tab
-
Display a plot of stress vs strain for the chosen options.
- Convex analysis tab
-
Display results of convex analysis of the stress-strain calculation. The analysis is performed by clicking the Compute button.
- Plot area
- Noise factor text box
-
This factor controls the amount of noise allowed in the fitting process, and hence the quality of the fit. The larger the factor, the more noise is allowed. A larger noise factor allows you to fit noisier data, where it may be difficult to determine whether the curve is convex or not.
- Range text boxes
-
These boxes show the actual values of the strain over which the convex analysis is performed, corresponding to the vertical green lines in the plot. You can copy the values, but not edit them.
- Compute button
-
Perform the convex analysis. If it is successful, the values of the strain at the maximum stress are plotted on the right. A warning is posted if the analysis fails. You can then reduce the range by dragging the green vertical lines on the left plot, so that the curve is convex, or increase the noise factor, or both, depending on the behavior of the raw data. Click again after adjustment to perform the convex analysis with the changed parameters.
This area displays two plots.
The plot on the left shows the stress against the strain, as in the General tab, plotted in red. The range of strain values that is fitted when you click Compute is the green area between two vertical green lines. You can drag these lines to change the range of strain values in the fit, which you may need to do if the curve in the fitting area is not convex. The fitted curve from the analysis is plotted in blue.
The plot on the right shows the strain at maximum stress as a function of the strain used in the fit, and is generated when you click Compute. For a given value of the strain, the maximum stress is found for strain values up to this value, and the strain at the maximum stress is plotted for this value. The curve is usually increasing linearly at first, and then may reach a plateau. The value of the strain at the first plateau is taken to be the yield strain. You can obtain a more precise value from the y value shown at the top right of the plot area when you pause the pointer over one of the points on the plateau.
- Residual strain fit tab
-
Show plot of the residual strain as a function of normal, transverse, or effective strain, with equations for the data fit and the derived yield strain.
- Plot area
-
Plot of residual strain as a function of normal, transverse, or effective strain and displays the lines and curves that are used to determine the yield strain. The points are fit to a hyperbola, which is displayed as a red solid line, and the two asymptotes are displayed as blue dashed lines. The yield strain is taken as the strain at which the two asymptotes intersect.
The non-asymptotic region in the hyperbola fit is indicated by a yellow colored region (it may be very narrow, depending on the data). Changing the asymptotic convergence threshold changes the size of this region.
Points can be selected in the plot area and removed from the fit by clicking Remove Selected Points from Fits. They can be restored by clicking Restore All Points. The fit is updated as you remove or restore points.
- Asymptotic convergence threshold box
-
This parameter determines the size of the non-asymptotic region for the hyperbola fit. A value of 1 makes the size infinite; a value of 0.5 makes the size zero. The fit is considered to have converged if there are points outside the non-asymptotic region on both sides. The convergence is indicated by a mark next to the left of the Store Yield Strain button. If convergence is not obtained, you can change this value to ensure that there are points in the asymptotic region.
- Remove Selected Points from Fits button
-
Click this button after selecting one or more points on the plot to remove them from the fit for the yield strain.
- Restore All Points button
-
Restore all points to the plot, to be used for fitting.
- Low strain asymptote, High strain asymptote, and Yield Strain text boxes
-
These boxes display the equations of the asymptotes for the hyperbola fit, and the derived yield strain value. The equations and values are updated as you remove points from the plot or restore points to the plot. If the value of the yield strain is outside the data range, a message to this effect is shown instead of the value.
- Store Yield Strain button
-
Save the yield strain to the structure that was loaded. This button allows you to save the yield strain when you are satisfied with the fit to the data: it is not done automatically. The yield strain is not stored if it is outside the data range.
- Yield strain uncertainty tab
-
Estimate the uncertainty in yield strain due to the simulation. This is done by creating synthetic data from the simulation data by adding random Gaussian noise, and fitting the results to give a distribution of yield strain values from which a mean and standard deviation are derived.
- Plot area
-
This area displays a histogram plot of the probability of the predicted yield strain value occurring in the synthetic data against the predicted yield strain.
- Sampling section
-
Set parameters for the synthetic data used for uncertainty quantification.
- Viewing section
-
Make settings for display of the synthetic data used for uncertainty analysis.
- Number of bins text box
-
Number of bins for the partitioning of the yield strain predictions from the synthetic data for the histogram plot.
- Normal fit option
-
Display the Gaussian fit to the yield strain predictions, and calculate the mean, standard deviation, and RMSD.
- mean, standard deviation, RMSD text boxes
-
Show the mean, standard deviation, and RMSD from the Gaussian fit to the yield strain predictions.
- Export Data button
-
Export the raw data used in the analyses to a CSV file. Opens a file browser to choose a location and name the file. If the data is an aggregate from multiple simulations, it is the aggregated data that is exported.
- Status bar
-
 to reset the panel to its default settings and clear any data from the panel.
If you can submit a job from the panel, the status bar displays information about the current job settings and status for the panel. The settings include the job name, task name and task settings (if any), number of subjobs (if any) and the host name and job incorporation setting. The job status can include messages about job start, job completion and incorporation.
The status bar also contains the Help button
 , which opens an option menu with choices to open the help topic for the panel (Documentation), launch Maestro Assistant, or if available, choose from an option menu of Tutorials. If the panel is used by one or more tutorials, hover over the Tutorials option to display a list of tutorials. Choosing a tutorial opens the tutorial topic.