Structure Factor Viewer Panel
Plot 1D and 2D structure factors from a structure factor calculation.
To open this panel: click the Tasks button and browse to Materials → Classical Mechanics → Trajectory Analysis → Structure Factor Results.
To open this panel from the entry group for the results of a structure factor job .
.
The following licenses are required to use this panel: MS Maestro
- Using
- Features
- Additional Resources
Using the Structure Factor Viewer Panel
This panel provides some tools for analyzing the peaks in the structure factor plot, to identify morphologies. Peak predictions, based on input for the first peak, can be displayed in the plot for a number of common morphologies. You can pick the first peak directly in the plot, or enter the q value for the peak. You can also pick peaks and export the q, L and q ratio values for the peaks to a file.
Structure Factor Viewer Panel Features
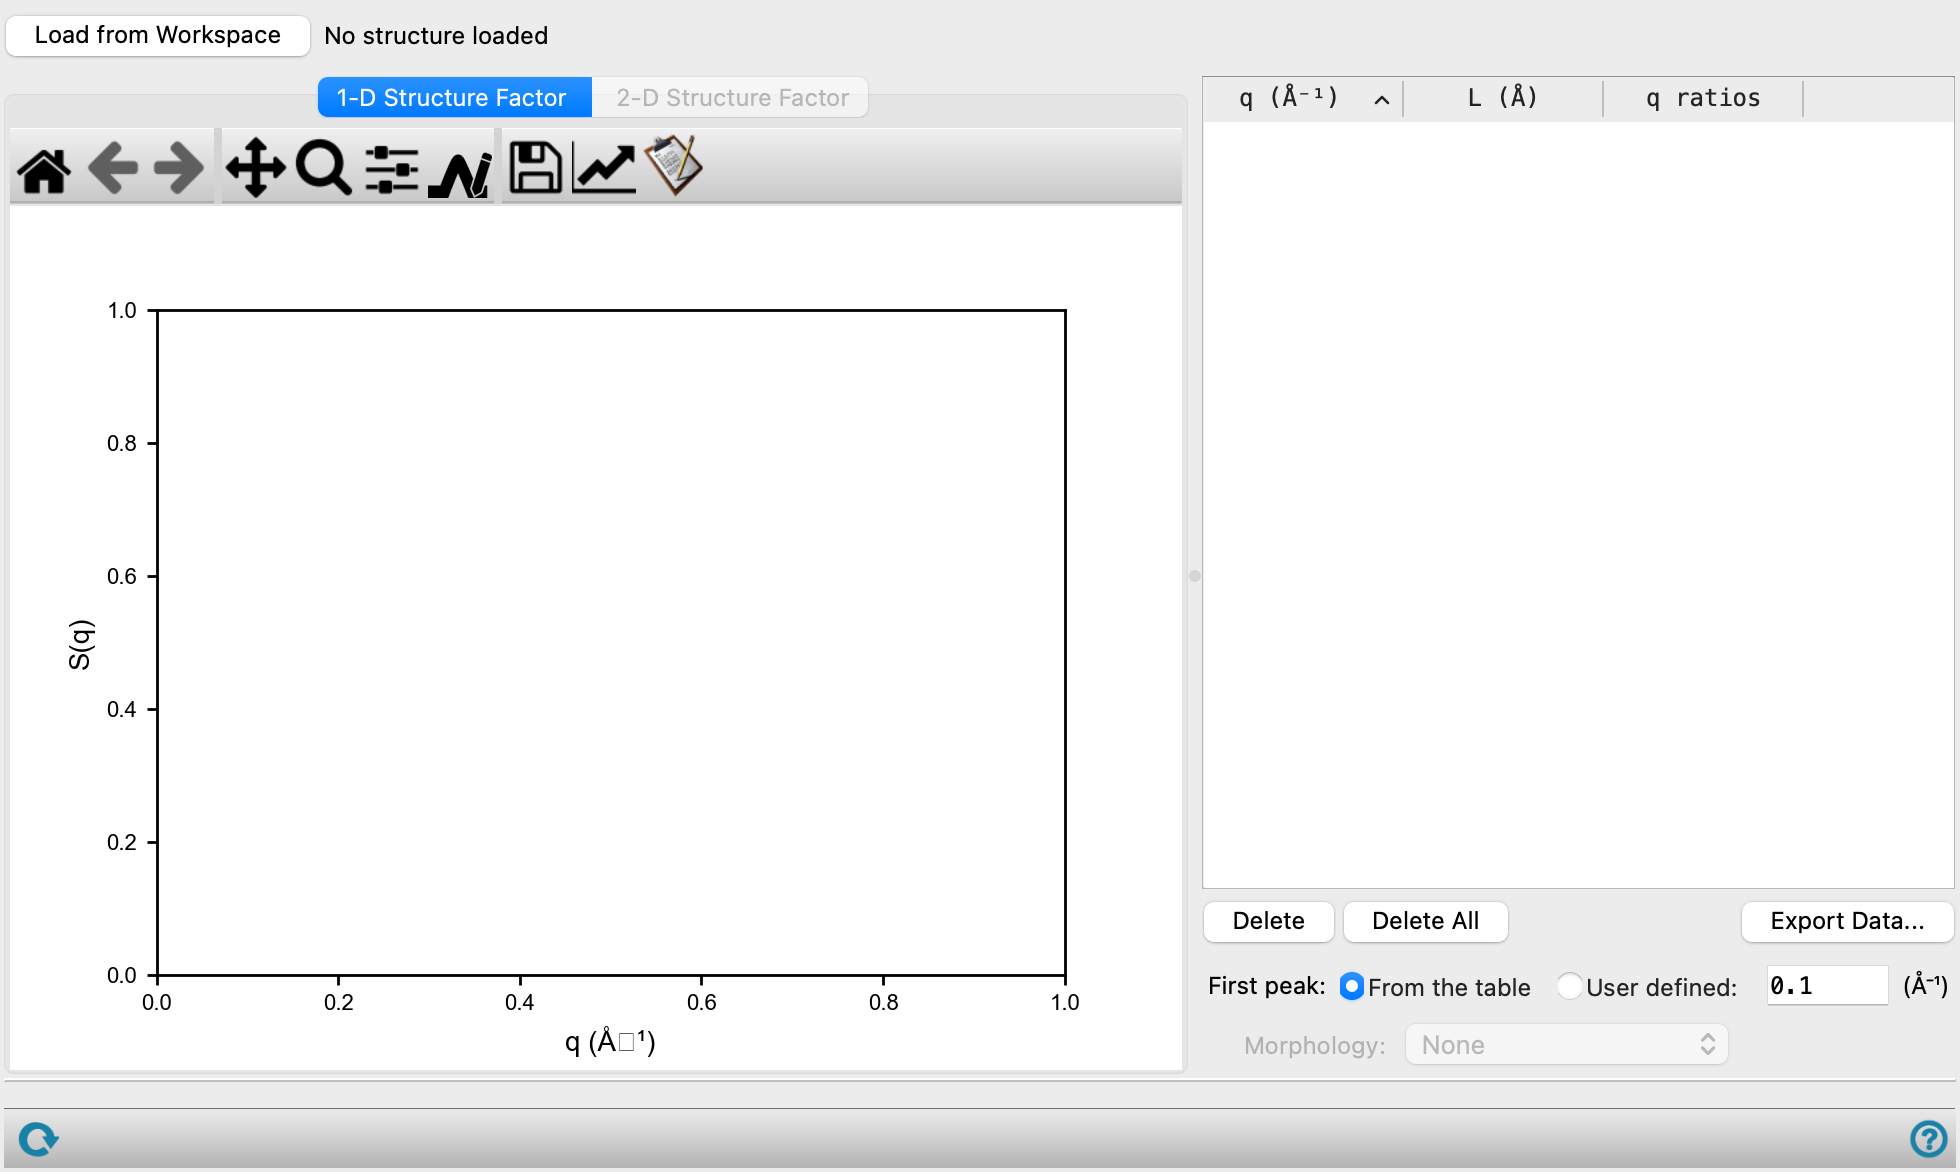
- Load from Workspace button
-
Display structure factors for the Workspace structure. The structure must come from a structure factor calculation.
- 1D Structure Factor tab
-
Plot the 1D structure factor. The toolbar buttons are described in Plot Toolbar, except for the Pick peaks button.
- 2D Structure Factor tab
-
Plot the 2D structure factor.
- Plot toolbar
-
The toolbar has tools for manipulating the plot and for saving images. The buttons that are common to all plot toolbars are described in the Plot Toolbar topic.
-
There is one extra button, for picking peaks in the viewer.

Click this button, then click on a peak in the plot. The peak is marked, and data for the peak is added to the structure factor table. Right-click on a peak to deselect it and remove it from the table. - Structure factor table
-
This table lists q, L and q ratios. Rows are added to the table when you use the peak picking tool to click on a peak in either of the plots, and they are removed when you right-click on a selected peak in the plot. You can also delete rows with the Delete and Delete All buttons.
- First peak options
-
Specify the source of the first peak, which is used to display the predicted peaks for a chosen morphology.
- From the table—take the first peak from the table.
- User defined—set the position of the first peak in the text box.
- Morphology option menu
-
This menu lists common morphologies. When you choose a morphology, a series of vertical lines are added to the plot at the expected peak positions, based on the definition of the first peak. You can change the morphology and the first peak position to see which morphology best fits the data.
- Status bar
-
 to reset the panel to its default settings and clear any data from the panel.
If you can submit a job from the panel, the status bar displays information about the current job settings and status for the panel. The settings include the job name, task name and task settings (if any), number of subjobs (if any) and the host name and job incorporation setting. The job status can include messages about job start, job completion and incorporation.
The status bar also contains the Help button
 , which opens an option menu with choices to open the help topic for the panel (Documentation), launch Maestro Assistant, or if available, choose from an option menu of Tutorials. If the panel is used by one or more tutorials, hover over the Tutorials option to display a list of tutorials. Choosing a tutorial opens the tutorial topic.