Thin Plane Shear Viewer Panel
Display the results of a thin plane shear calculation including plots of drag force, friction coefficient, and the velocity gradient.
To display this panel: click the Tasks button and browse to Materials → Classical Mechanics → Thin Plane Shear → Thin Plane Shear Results
To open this panel from the entry group for the results of a job .
.
The following licenses are required to use this panel: MS Maestro, MS Transport
- Features
- Additional Resources
Thin Plane Shear Viewer Panel Features
- Load from Workspace button
-
Load the data associated with the structure in the Workspace, which must be the output structure from a job run from the Thin Plane Shear Panel.
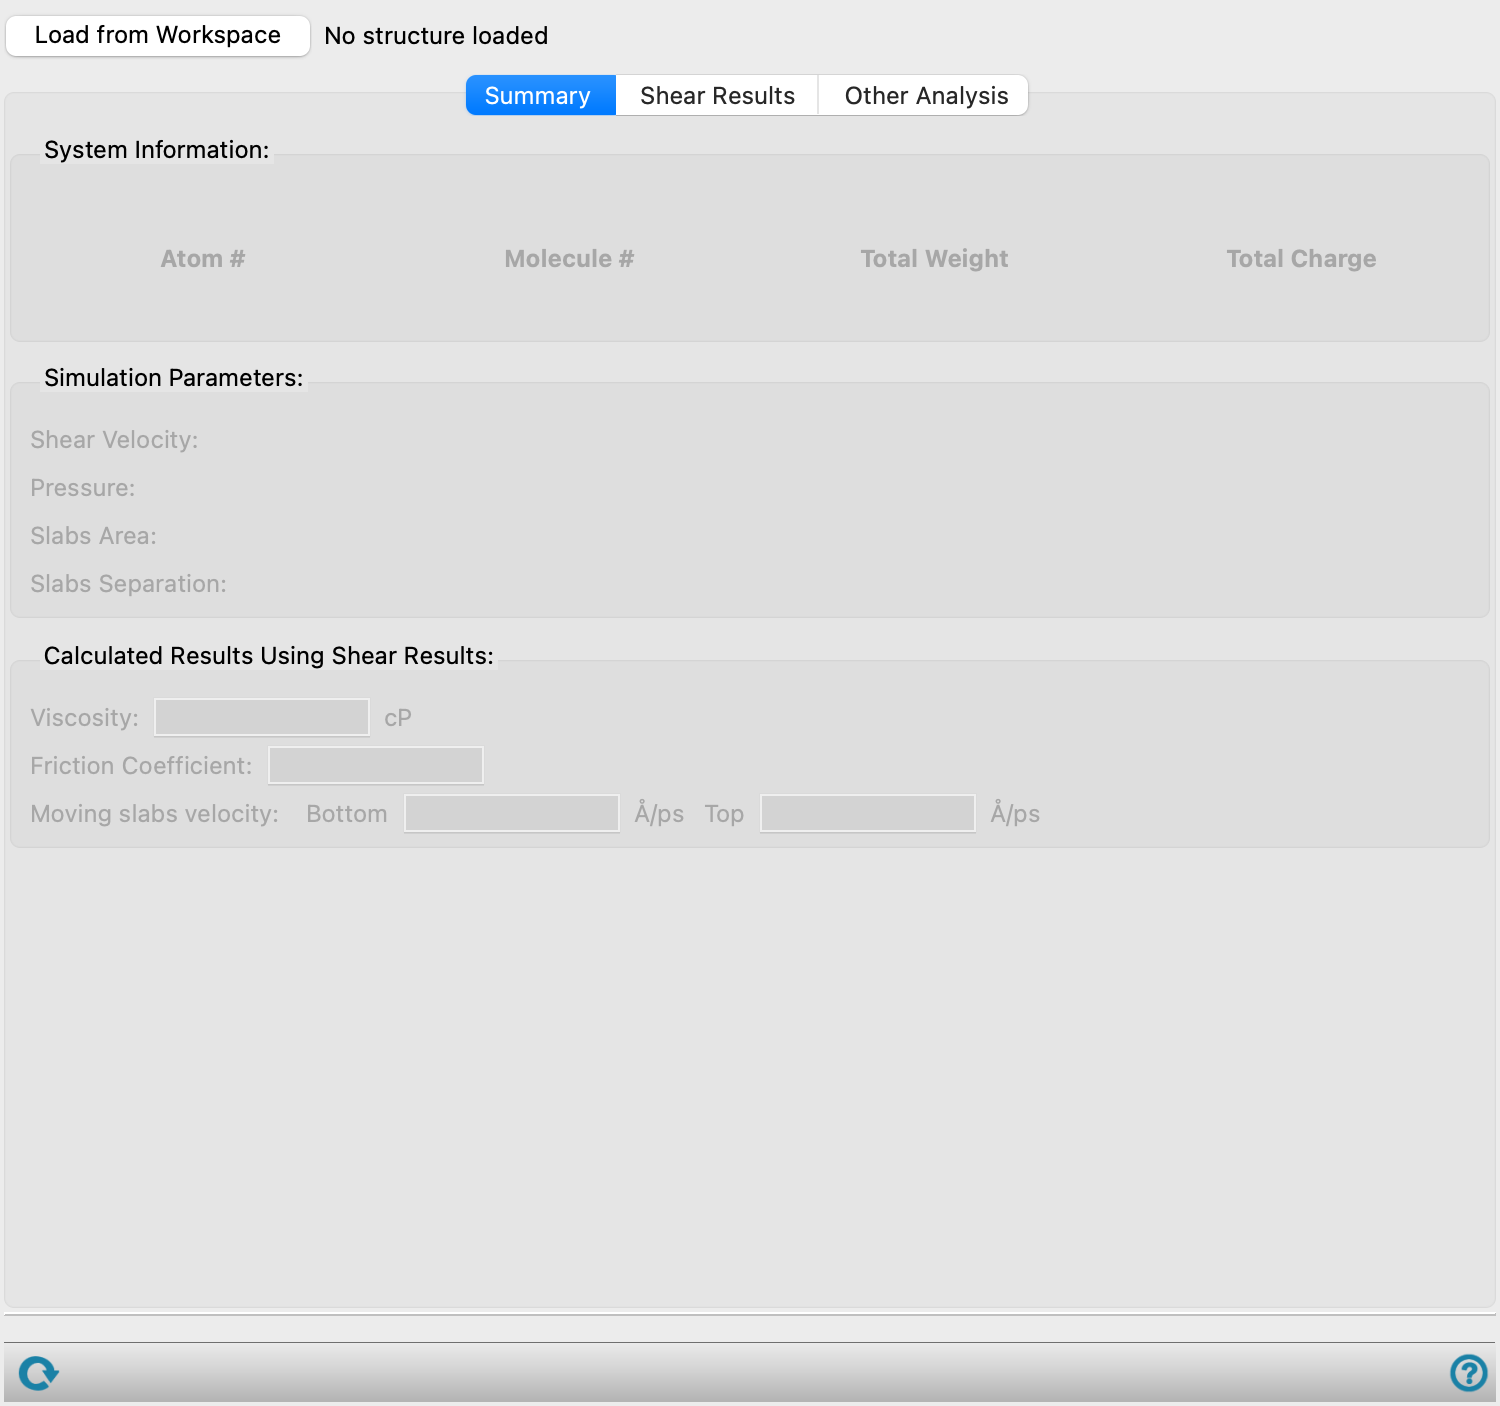
- Summary tab
-
This tab displays the value of various parameters used for running the workflow and results obtained from the simulation in noneditable text boxes.
- System Information section
-
For the loaded structure, this section provides the number of atoms (Atom #), number of molecules (Molecule #), Total Weight in atomic mass units, and Total Charge.
- Simulation Parameters section
-
Displays noneditable values calculated from the parameters chosen in Thin Plane Shear Panel.
- Shear velocity text
-
Displays the shear velocity applied to the slabs, in Å/ps. Noneditable.
- Pressure text
-
Displays the normal pressure applied to the slabs, in bar. Noneditable.
- Slabs Area text
-
Displays the surface area of the slabs, in Å2. Noneditable.
- Slabs Separation text
-
Displays the distance between the two slabs, in angstrom. Noneditable.
- Viscosity text box
-
Displays the viscosity of the system, in centipoise. Updating the simulation range in the Shear Results tab recalculates the viscosity. Noneditable.
- Friction Coefficient text box
-
Displays the friction coefficient of the system. Updating the simulation range in the Shear Results tab recalculates the friction coefficient. Noneditable.
- Moving slabs velocity text boxes
-
Displays the velocity of the top and bottom slabs, in Å/ps. The velocities of the slab atoms in the direction of shearing (the x direction) are averaged over the selected frames. Here, we consider slab atoms as all heavy atoms within molecules that have at least one of their atoms inside the defined slab region. Updating the simulation range in the Shear Results tab recalculates the velocities. Noneditable.
- Shear Results tab
-
Displays the plot of the drag force or friction coefficient as a function of simulation time with the option to adjust the range of simulation times used for the property values derived from it.
- Y-Axis options
-
Choose what to plot on the y-axis, from Drag Force and Friction Coefficient.
- Plot toolbar
-
The toolbar has tools for manipulating the plot and for saving images. The buttons that are common to all plot toolbars are described in the Plot Toolbar topic.
- Plot area
-
This area displays the plot of the drag force (Kcal/mol/Å) or friction coefficient against simulation time (ps). You can adjust the range of simulation times used for the property calculations, by dragging the vertical dotted lines on the plot. The Viscosity, Friction Coefficient, and Moving slabs velocity values are recalculated using the selected range from the moving average window. If a moving average window is used, the fit line is plotted in green.
- Moving average window text box
-
Specify the moving average window as a percentage of the total number of data points. The time associated with the selected moving average window is displayed to the right of the text box. The plot is updated with the moving average of the selected data and the fit line is plotted in green. Only available when there are more than 100 data points.
- Viscosity text box
-
Displays the viscosity of the system, in centipoise. Updating the simulation range in the Shear Results tab recalculates the viscosity. Noneditable.
- Friction Coefficient text box
-
Displays the friction coefficient of the system. Updating the simulation range in the Shear Results tab recalculates the friction coefficient. Noneditable.
- Other Analysis tab
-
Displays the plot of velocity as a function of box height for the bulk system.
- Plot toolbar
-
The toolbar has tools for manipulating the plot and for saving images. The buttons that are common to all plot toolbars are described in the Plot Toolbar topic.
- Plot area
-
This area displays the instantaneous velocity in shearing direction (x-direction) (Å/ps) and number density against box height (Å) for the bulk system. Here, we consider the bulk system as all atoms that do not overlap with moving slabs. The bulk area is divided into sections of 5 Å thickness and the velocity and number density of heavy atoms in each section are averaged over the simulation range selected in the Shear Results tab.
-
The plotted velocity is the average instantaneous velocity in the slab and allows us to determine if the simulation was run for a sufficient amount of time.
- Moving slabs velocity text boxes
-
Displays the velocity of the top and bottom slabs, in Å/ps. The velocities of the slab atoms in the direction of shearing are averaged over the selected frames. Here, we consider slab atoms as all heavy atoms within molecules that have at least one of their atoms inside the defined slab region. Updating the simulation range in the Shear Results tab recalculates the velocities. Noneditable.
- Status bar
-
 to reset the panel to its default settings and clear any data from the panel.
If you can submit a job from the panel, the status bar displays information about the current job settings and status for the panel. The settings include the job name, task name and task settings (if any), number of subjobs (if any) and the host name and job incorporation setting. The job status can include messages about job start, job completion and incorporation.
The status bar also contains the Help button
 , which opens an option menu with choices to open the help topic for the panel (Documentation), launch Maestro Assistant, or if available, choose from an option menu of Tutorials. If the panel is used by one or more tutorials, hover over the Tutorials option to display a list of tutorials. Choosing a tutorial opens the tutorial topic.