Torsion Profile Analysis Viewer Panel
Display profiles of torsional angles in a trajectory as radial and histogram plots.
To open this panel: click the Tasks button and browse to Materials → Tools → Torsion Profile Analysis Results.
The following licenses are required to use this panel: MS Maestro
- Using
- Features
- Additional Resources
Using the Torsion Profile Analysis Viewer Panel
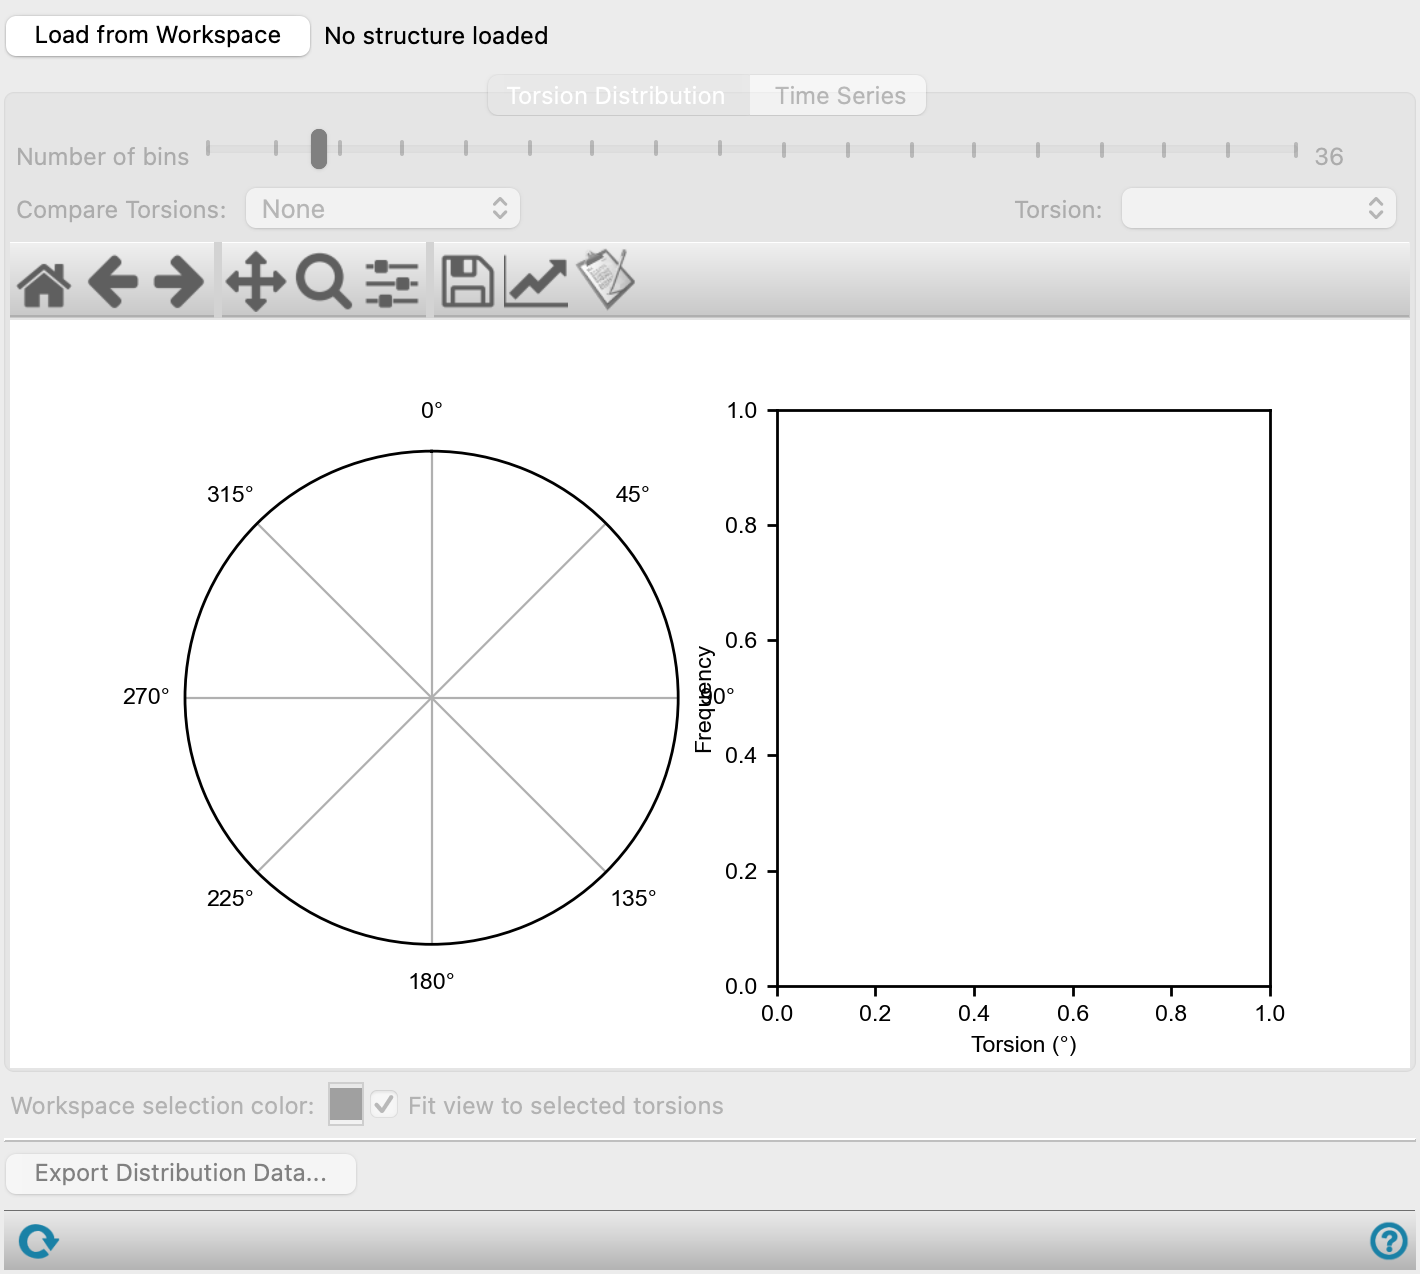
The radial plots in the Torsion Distribution tab allow you to compare the torsion profile of up to six torsions; the histogram plot allows you to examine the distribution of angle values for an individual torsion, and higlight the torsions in the Workspace. For a trajectory, the Time Series tab shows a plot for either each individual angle value or a distribution of angle values for a chosen torsion, as a function of simulation time (trajectory frame).
To open this panel from the entry group for the results of a torsion profile analysis job .
.
Torsion Profile Analysis Viewer Panel Features
- Load from Workspace tab
-
Load the results for the structure that is displayed in the Workspace. The structure must be the output structure of a torsion profile analysis.
- Torsion Distribution tab
-
This tab displays the torsional profiles for several torsions on a radial plot, and for a single torsion on a histogram plot.
- Number of bins slider
-
Set the number of bins used for binning the torsional angles.
- Compare torsions option menu
-
Select the torsions to compare on the radial plot. Each item on the menu has a check box for showing or hiding the torsional profile in the plot. You can compare up to six torsions.
- Torsion option menu
-
Choose the torsion to display in the histogram plot.
- Plot toolbar
-
The toolbar has tools for manipulating the plot and for saving images. The buttons that are common to all plot toolbars are described in the Plot Toolbar topic.
- Plot area
-
This area displays two plots: a radial plot on which the torsional profile of several torsions can be displayed, and a histogram plot of frequency against torsion for a single torsion. When you click on bars in the histogram, the contributing torsions are highlighted in the Workspace in the color chosen with the Workspace selection color color button. Right-clicking removes the highlight.
- Time Series tab
-
This tab displays either individual angle values or the distribution of angle values for a selected torsion as a function of simulation time. If you chose not to analyze a trajectory, or you chose only one frame to analyze, this tab is not present.
- Torsion option menu
-
Select the torsion to show in the time series plot.
- Plot type options
-
Choose the type of plot to display in the plot area.
- Values—displays the angles for each individual torsion as a bar plot over the simulation time range, with colors denoting the size of the angle.
- Distribution—displays the torsion angle distribution for a selected torsion as a bar plot over the simulation time range, with colors denoting the frequency of occurrence normalized over the whole trajectory.
- Show torsions slider and text boxes
-
Show the range of individual torsions in the time series plot specified by the slider and text boxes. Showing a large number of torsions makes it difficult to distinguish details. As the torsions are sorted in ascending order of variability, it is often sufficient to show only the high-index torsions to examine the variations. By default, the last 300 torsions are shown in the plot.
Only present when Values is chosen as the Plot type.
- Number of bins slider
-
Set the number of bins used for binning the torsional angles.
Only present when Distribution is chosen as the Plot type.
- Show values relative to initial torsion option
-
Select this option to display the change in torsion angle relative to the angle in the initial trajectory frame, instead of absolute angles, as values in the bar plot.
- Plot toolbar
-
The toolbar has tools for manipulating the plot and for saving images. The buttons that are common to all plot toolbars are described in the Plot Toolbar topic.
- Plot area
-
If Values is chosen as the Plot type, this area displays the plot of torsion index against simulation time (trajectory frame). The torsional angles are represented by a color map, whose legend is to the right of the plot. If the Show values relative to initial torsion option is chosen, the color map represents the torsion angle relative to the torsion in the initial trajectory frame. The torsions are sorted according to the range of angles, so the torsion with the largest variation in angle is at the top, and the torsion with the smallest variation is at the bottom. Clicking on one of the cells in the plot highlights the individual torsion for the associated trajectory frame in the Workspace.
If Distribution is chosen as the Plot type, this area displays the plot of the distribution of torsion angles against simulation time (trajectory frame). The normalized frequency of angle values are represented by a color map, whose legend is to the right of the plot. If the Show values relative to initial torsion option is chosen, the y-axis represents the torsion angles relative to the torsion in the initial trajectory frame.
- Workspace selection color color button
-
Select the color used to highlight the atoms in the Workspace that belong to the torsions picked on a plot. The button is colored with the current choice.
- Fit view to selected atoms check box
-
Zoom the Workspace view in to the atoms in the torsions that are selected in a plot.
- Export Distribution Data button
-
Export the data on the distribution of torsions. Opens a file selector in which you can name and save the file.
- Status bar
-
 to reset the panel to its default settings and clear any data from the panel.
If you can submit a job from the panel, the status bar displays information about the current job settings and status for the panel. The settings include the job name, task name and task settings (if any), number of subjobs (if any) and the host name and job incorporation setting. The job status can include messages about job start, job completion and incorporation.
The status bar also contains the Help button
 , which opens an option menu with choices to open the help topic for the panel (Documentation), launch Maestro Assistant, or if available, choose from an option menu of Tutorials. If the panel is used by one or more tutorials, hover over the Tutorials option to display a list of tutorials. Choosing a tutorial opens the tutorial topic.