Trajectory Density Analysis Viewer Panel
View 1D and 2D profiles of the averaged density from a trajectory, generated using the Trajectory Density Analysis Panel.
To open this panel: click the Tasks button and browse to Materials → Classical Mechanics → Trajectory Analysis → Trajectory Density Analysis Results.
To open this panel from the entry group for the results of a trajectory density analysis job .
.
The following licenses are required to use this panel: MS Maestro
- Features
- Additional Resources
Trajectory Density Analysis Viewer Panel Features
- Load from Workspace button
-
Load the analysis data associated with the structure in the Workspace, which must be the output structure from a job run from the Trajectory Density Analysis Panel.
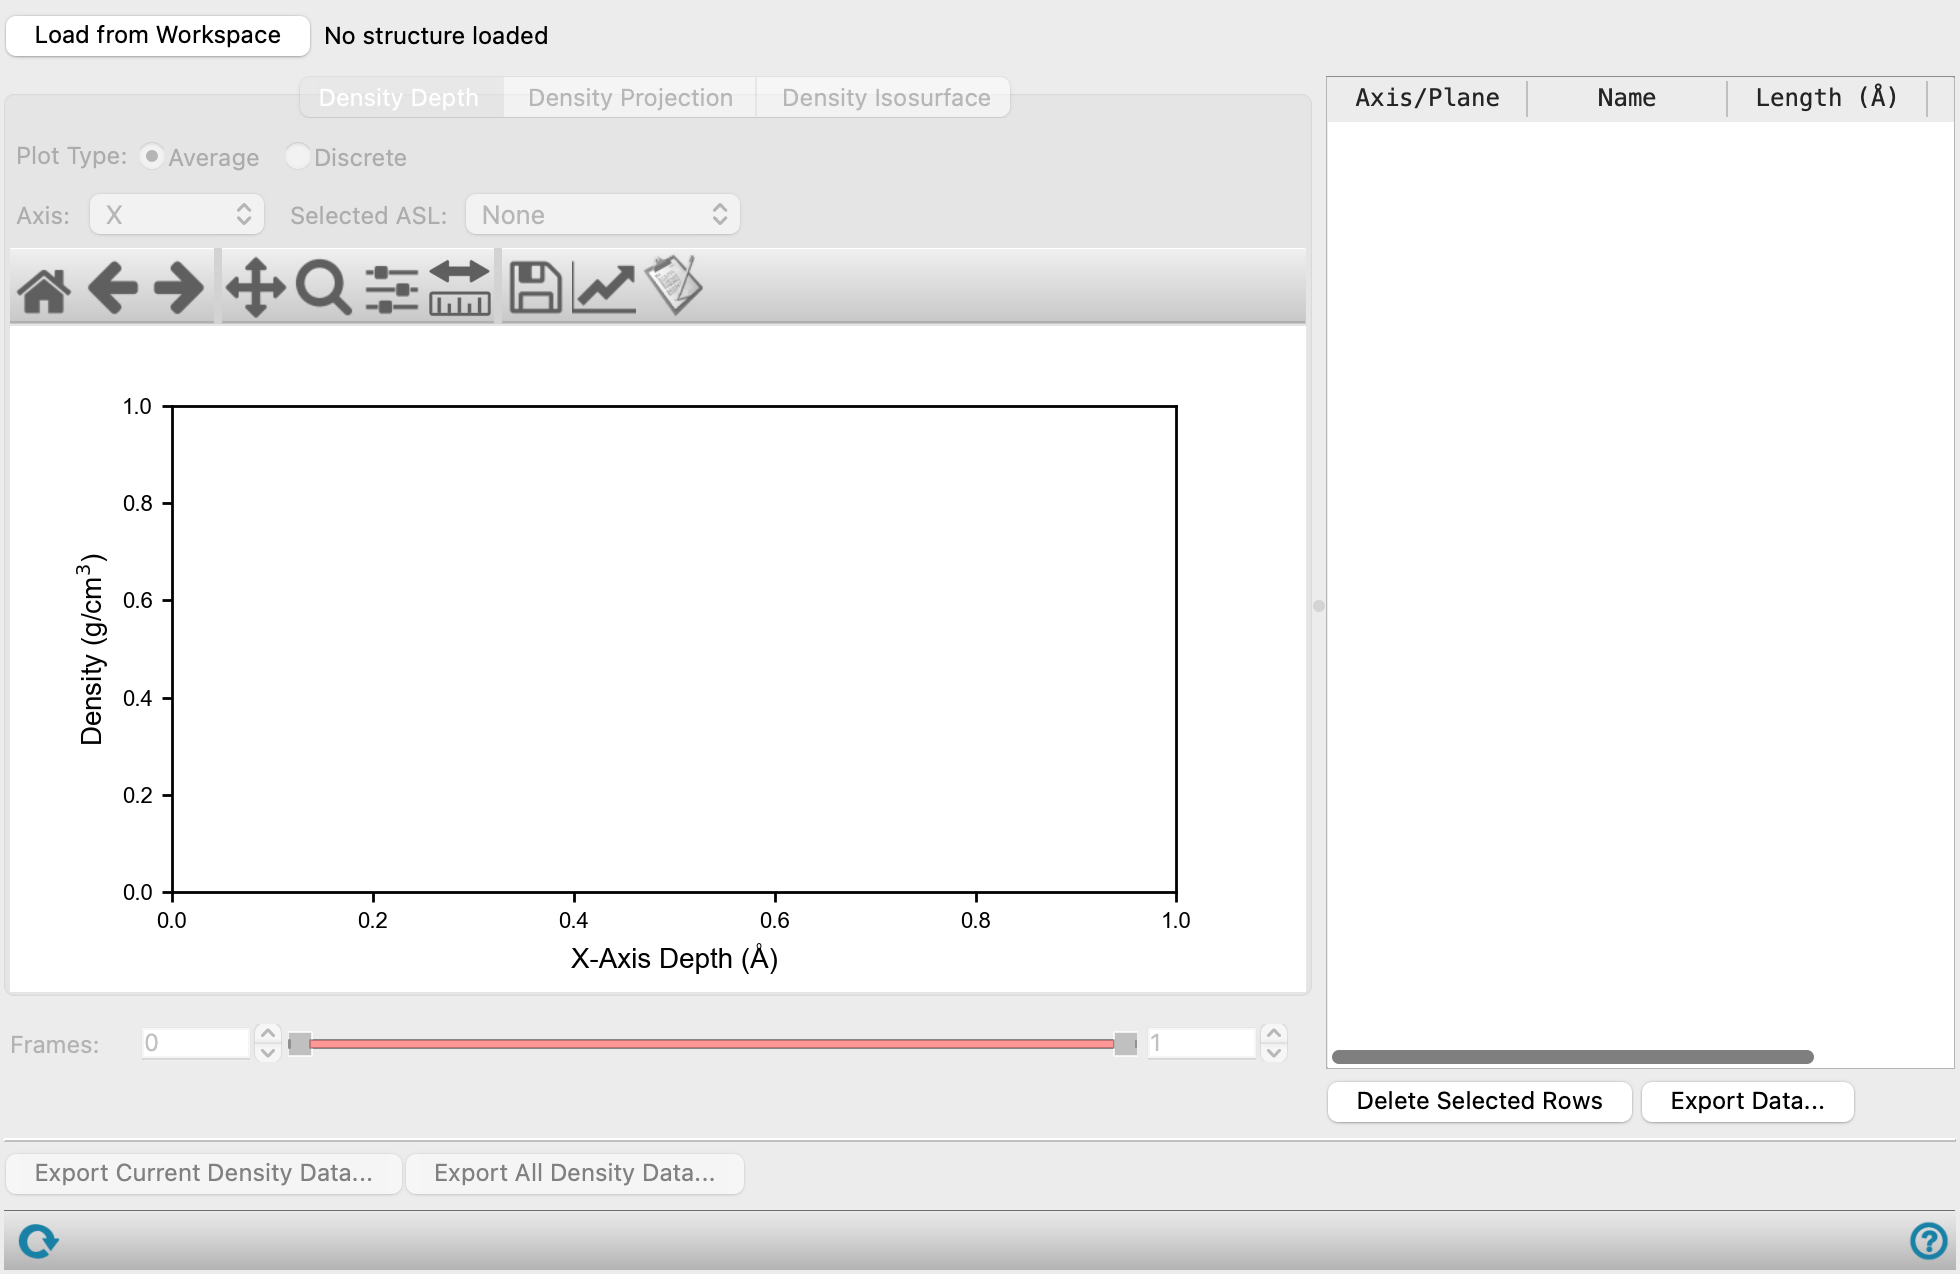
- Density Depth tab
-
This tab displays a plot of the density profile as a function of the depth along a chosen axis.
- Plot type options
-
Specify the method of plotting to use for the density depth:
- Average—Plot the density depth as an average of the selected frames.
- Discrete—Plot discrete density depths at each of the selected frames.
- Axis option menu
-
Choose the Cartesian axis (x, y, or z) along which you want to examine the density profile. The plot is updated when you change the axis.
- Selected ASL option menu
-
Choose the structure components whose density profile you want to examine. The menu contains the selection names that you entered into the Trajectory Density Analysis Panel. Each selection name has a check box, so you can select multiple items to plot.
- Plot toolbar
-
The toolbar has tools for manipulating the plot and for saving images. The buttons that are common to all plot toolbars are described in the Plot Toolbar topic.
- Plot area
-
This area displays the plot of density against depth for one or more structure components. If Average is selected as the Plot type, the plot is determined by averaging the density values over the selected simulation frames. If Discrete is selected as the Plot type, the iterations to plot density for can be determined using the Number of profiles text box and Frames slider.
A legend is displayed for the structure components and iterations when available.
You can measure depth distances between points on a graph by clicking the Measure button then clicking on pairs of points. The distances are listed in the depth measurements table to the right of the graph. Right-clicking on the plot removes the nearest measurement from the plot and the table.
- Frames slider and text boxes
-
Control the range of the trajectory over which the average density is computed. Only present if Average is selected as the Plot type.
- Number of profiles text box
-
Specify how many iterations to display. This determines the number of lines plotted and number of thumbs shown on the Frames slider. Only present if Discrete is selected as the Plot type.
- Frames slider
-
Set the iterations to display in the plot by using the thumbs on the slider. Right-click on the slider or a thumb to see additional options such as, Add Thumb, Remove Thumb, and a text box to specify the iteration number. Only present if Discrete is selected as the Plot type.

In addition to the common buttons, the toolbar has a Measure button for measuring depth (horizontal) distances between points on the plot. When you click this button, you can pick two points and the depth distance between them is displayed on the plot and listed in the measurements table. - Density Projection tab
-
This tab displays a 2D plot of the density projected onto a chosen coordinate plane. The projected density is normalized by the projection area.
- Plane option menu
-
Choose the plane onto which the density is projected. The plot is updated when you change the choice of plane.
- Selected ASL option menu
-
Choose the structure component whose density projection you want to examine. The menu contains the selection names that you entered into the Trajectory Density Analysis Panel. Only one component can be displayed at a time.
- Plot toolbar
-
The toolbar has tools for manipulating the plot and for saving images. The buttons that are common to all plot toolbars are described in the Plot Toolbar topic.
- Plot area
-
This area displays the plot of the normalized density projection onto a plane. The legend shows the mapping of color to area density.
You can measure distances between points on the plot by clicking the Measure button then clicking on pairs of points. The distances are listed in the measurements table to the right of the graph. Right-clicking on the plot removes the nearest measurement from the plot and the table.
- Frames slider and text boxes
-
Control the range of the trajectory over which the average density is computed.
In addition to the common buttons, the toolbar has a Measure button for measuring distances between points on the plot. When you click this button, you can pick two points and the distance between them is displayed on the plot and listed in the measurements table. To automatically align the two points at a set angle relative to the x-axis, click on the first point, then press and hold the Shift key, then click on the second point. The second point is automatically adjusted such that the line joining the two points is parallel, perpendicular, or at a +45°/-45° angle to the x-axis depending on where the second point was initially placed. If the projection of the second point is outside the plot region, a warning message is shown. - Density Isosurface tab
-
This tab displays a density isosurface in the Workspace for the selected group of atoms.
- Selected ASL option menu
-
Choose the structure components whose density isosurface you want to examine. The menu contains the selection names that you entered into the Trajectory Density Analysis Panel. Each selection name has a check box, so you can select multiple items to visualize.
- ASL stage
-
Each Selected ASL reaction has its own label, delete button, Isodensity slider, Transparency slider, and Surface color button. The ASL stage label indicates the selected group of atoms. Addition and removal of stages is done by selecting structure components in the Selected ASL option menu. A stage can also be removed using the deletion stage management button (
 ).
). - Isodensity slider
-
Set the isodensity value for displaying the density isosurface in the Workspace, in grams per cm3.
- Transparency slider
-
Set the transparency of the isosurface displayed in the Workspace. Only available when the Isodensity is set.
- Surface color button
-
Set the color used for the density isosurface in the Workspace. The current color is displayed on the button. Only available when the Isodensity is set.
- Simulation time slider
-
Control the simulation time for which the density isosurface is plotted. The isosurface updates when the slider is dragged to a different simulation time. Click the Play button to see the surface cycle through the simulation time.
- Measurements table
-
This table lists all the measurements you have made. They are identified by the axis or plane and the selection names (Name) that you entered into the Trajectory Density Analysis Panel. The structure components are also shown in the ASL column.
- Export Current Density Data button
-
Export the density data that is currently shown in the plot, as a CSV file. Opens a file selector, to name and save the file. If multiple structure components are shown in the plot, each has its own column of data in the CSV file. Only available for the Density Depth and Density Projection tabs.
- Export All Density Data button
-
Export the density data for all axes/planes and the selected structure components for the current tab. Opens a file selector, to name and save the file. The data for each axis/plane is saved in a separate file, with a suffix for the axis/plane added to the supplied name. If multiple structure components are shown in the plot, each has its own column of data in the CSV file. Only available for the Density Depth and Density Projection tabs.
- Status bar
-
 to reset the panel to its default settings and clear any data from the panel.
If you can submit a job from the panel, the status bar displays information about the current job settings and status for the panel. The settings include the job name, task name and task settings (if any), number of subjobs (if any) and the host name and job incorporation setting. The job status can include messages about job start, job completion and incorporation.
The status bar also contains the Help button
 , which opens an option menu with choices to open the help topic for the panel (Documentation), launch Maestro Assistant, or if available, choose from an option menu of Tutorials. If the panel is used by one or more tutorials, hover over the Tutorials option to display a list of tutorials. Choosing a tutorial opens the tutorial topic.