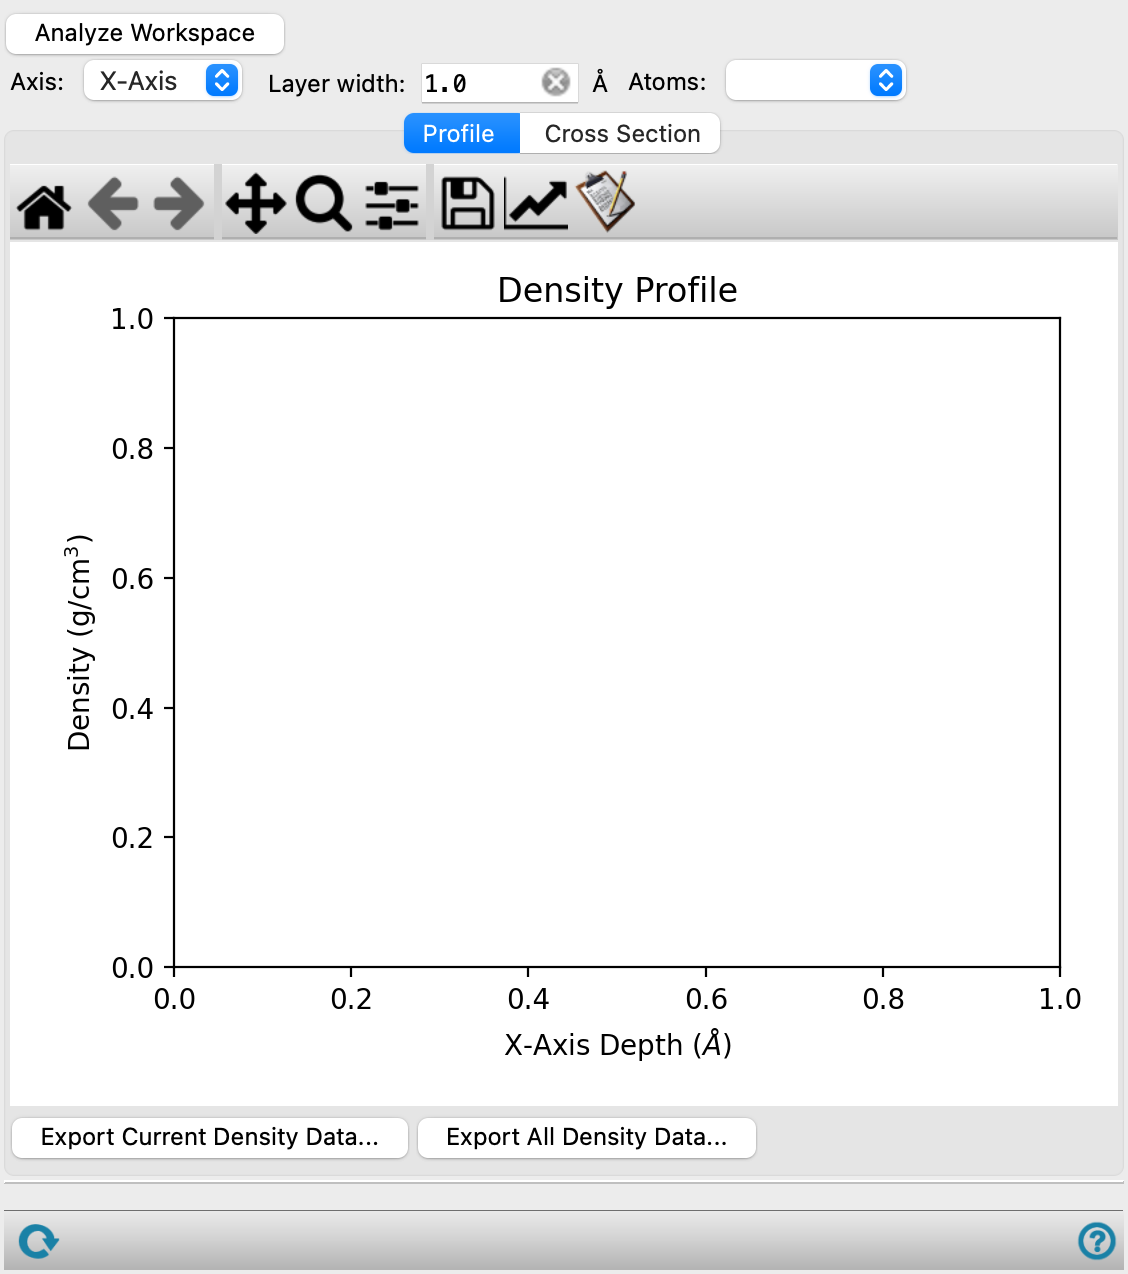
Density Profile Panel
Display a profile of the density along a selected axis, summed for atoms in layers perpendicular to the axis, or a cross-section of the density perpendicular to the selected axis at a chosen distance along the axis.
To open this panel: click the Tasks button and browse to Materials → Tools → Density Profile.
The following licenses are required to use this panel: MS Maestro
- Overview
- Features
- Additional Resources
Overview of Density Profiles
The density profile and the cross-sections are calculated by taking layers of a specified thickness perpendicular to a chosen Cartesian coordinate axis. To calculate the density profile at the particular point on the axis (defined as the coordinate at the bottom of the layer), the fraction of the van der Waals volume of each atom that overlaps the layer is multiplied by its atomic mass and the result is summed over all specified atoms, then divided by the volume of the layer. Likewise, for the cross section, the layer is partitioned into cubes and the volume fraction of each atom that overlaps each cube is determined and weighted by the atomic mass, summed and divided by the cube volume to give the density in the cube.
Density Profile Panel Features
- Analyze Workspace button
-
Analyze the Workspace structure to construct the density profile. If a trajectory is available, the last frame is used.
- Axis option menu
-
Choose the axis for the density profile or the cross section. The layers used to construct the profile or the cross section are perpendicular to this axis.
- Layer width text box
-
Specify the width of the layers used to calculate the density profile, in angstroms. If you change the value, the structure is reanalyzed.
- Atoms option menu
-
Choose the atom groups for which the density is calculated:
- All—calculate the density for all atoms.
- Element—calculate the density for the element specified in the text box. The default is carbon.
- SMARTS—calculate the density for the atoms in the SMARTS pattern given in the text box.
- Crosslinkable—calculate the density for the cross-linkable atoms. Only available for structures from a crosslinking run (see Crosslink Polymers Panel).
- Crosslinked—calculate the density for the cross-linked atoms. Only available for structures from a crosslinking run (see Crosslink Polymers Panel).
- Profile tab
-
Display a plot of the density as a function of the depth along the chosen axis.
- Plot toolbar
-
This is a standard plot toolbar, described in the Plot Toolbar topic.
- Plot area
-
Display the plot of the density due to the selected atoms, summed over slabs perpendicular to of the chosen axis, as a function of the depth along the chosen axis. Click on a section of the plot to display the corresponding heat map of the density perpendicular to the chosen axis at that distance in the Cross Section tab.
- Export Current Density Data button
-
Export the density data for the current choice of axis, width, and atoms, as a CSV file. Opens a file selector, to name and save the file.
- Export All Density Data button
-
Export the density data for all three axes, with the current width and atom selection, as three CSV files. Opens a file selector, to name and save the file. The axis name is appended to the file name stem, as
_X-Axis, etc., to generate the three file names.
- Cross Section tab
-
Display a heat map of the density perpendicular to the chosen axis, at a particular distance along the axis.
- Layer arrows, text, and text box
-
Click the arrows to step through the layers, or enter the layer number in the text box.
- Plot toolbar
-
This is a standard plot toolbar, described in the Plot Toolbar topic.
- Plot area
-
This area displays the plot, with the density legend to the right. Clicking on a spot in the plot highlights the corresponding atoms in the Workspace: atoms that contribute density to that spot are shown in CPK, atoms near those atoms (within 5 Å) are shown in wire frame, and all other atoms are hidden.
- Redisplay All Atoms button
-
Redisplay all atoms. This is useful when you have clicked in the plot to highlight particular regions.
- Status bar
-
 to reset the panel to its default settings and clear any data from the panel.
If you can submit a job from the panel, the status bar displays information about the current job settings and status for the panel. The settings include the job name, task name and task settings (if any), number of subjobs (if any) and the host name and job incorporation setting. The job status can include messages about job start, job completion and incorporation.
The status bar also contains the Help button
 , which opens an option menu with choices to open the help topic for the panel (Documentation), launch Maestro Assistant, or if available, choose from an option menu of Tutorials. If the panel is used by one or more tutorials, hover over the Tutorials option to display a list of tutorials. Choosing a tutorial opens the tutorial topic.