Diffusion Coefficient Viewer Panel
Display values of diffusion coefficients, plots of the mean square distance (MSD) against simulation time difference, and traces of the diffusing molecules in 2D and 3D as a function of simulation time. The fit of the MSD to obtain the diffusion coefficient can be adjusted.
To open this panel: click the Tasks button and browse to Materials → Classical Mechanics → Diffusion Coefficient → Diffusion Coefficient Results.
To open this panel from the entry group for the results of a diffusion coefficient job .
.
The following licenses are required to use this panel: MS Maestro, MS Transport
- Using
- Features
- Additional Resources
Using the Diffusion Coefficient Viewer Panel
The viewer allows you to examine the fit of the mean square distance (MSD) or the velocity autocorrelation as a function of tau, the simulation time difference, to see how well the fitted section displays a linear relationship. You can adjust the upper and lower limits of the fitted section, and save the resultant diffusion coefficient to the project entry. The initial left and right fitting limits are the values specified in the Diffusion Coefficient Panel.
Diffusion Coefficient Viewer Panel Features
- Use structures from option menu
-
Choose the structure source for the current task.
- Project Table (n selected entries)—Use the entries that are currently selected in the Project Table or Entry List. The number of entries selected is shown on the menu item.
- Workspace (n included entries)—Use the entries that are currently included in the Workspace, treated as separate structures. The number of entries in the Workspace is shown on the menu item.
- Project Table (n selected entries)—Use the entries that are currently selected in the Project Table or Entry List. The number of entries selected is shown on the menu item.
- Open Project Table button
-
Open the Project Table panel, so you can

- Load Data button
-
Load the data for the selected entries into the workflow.
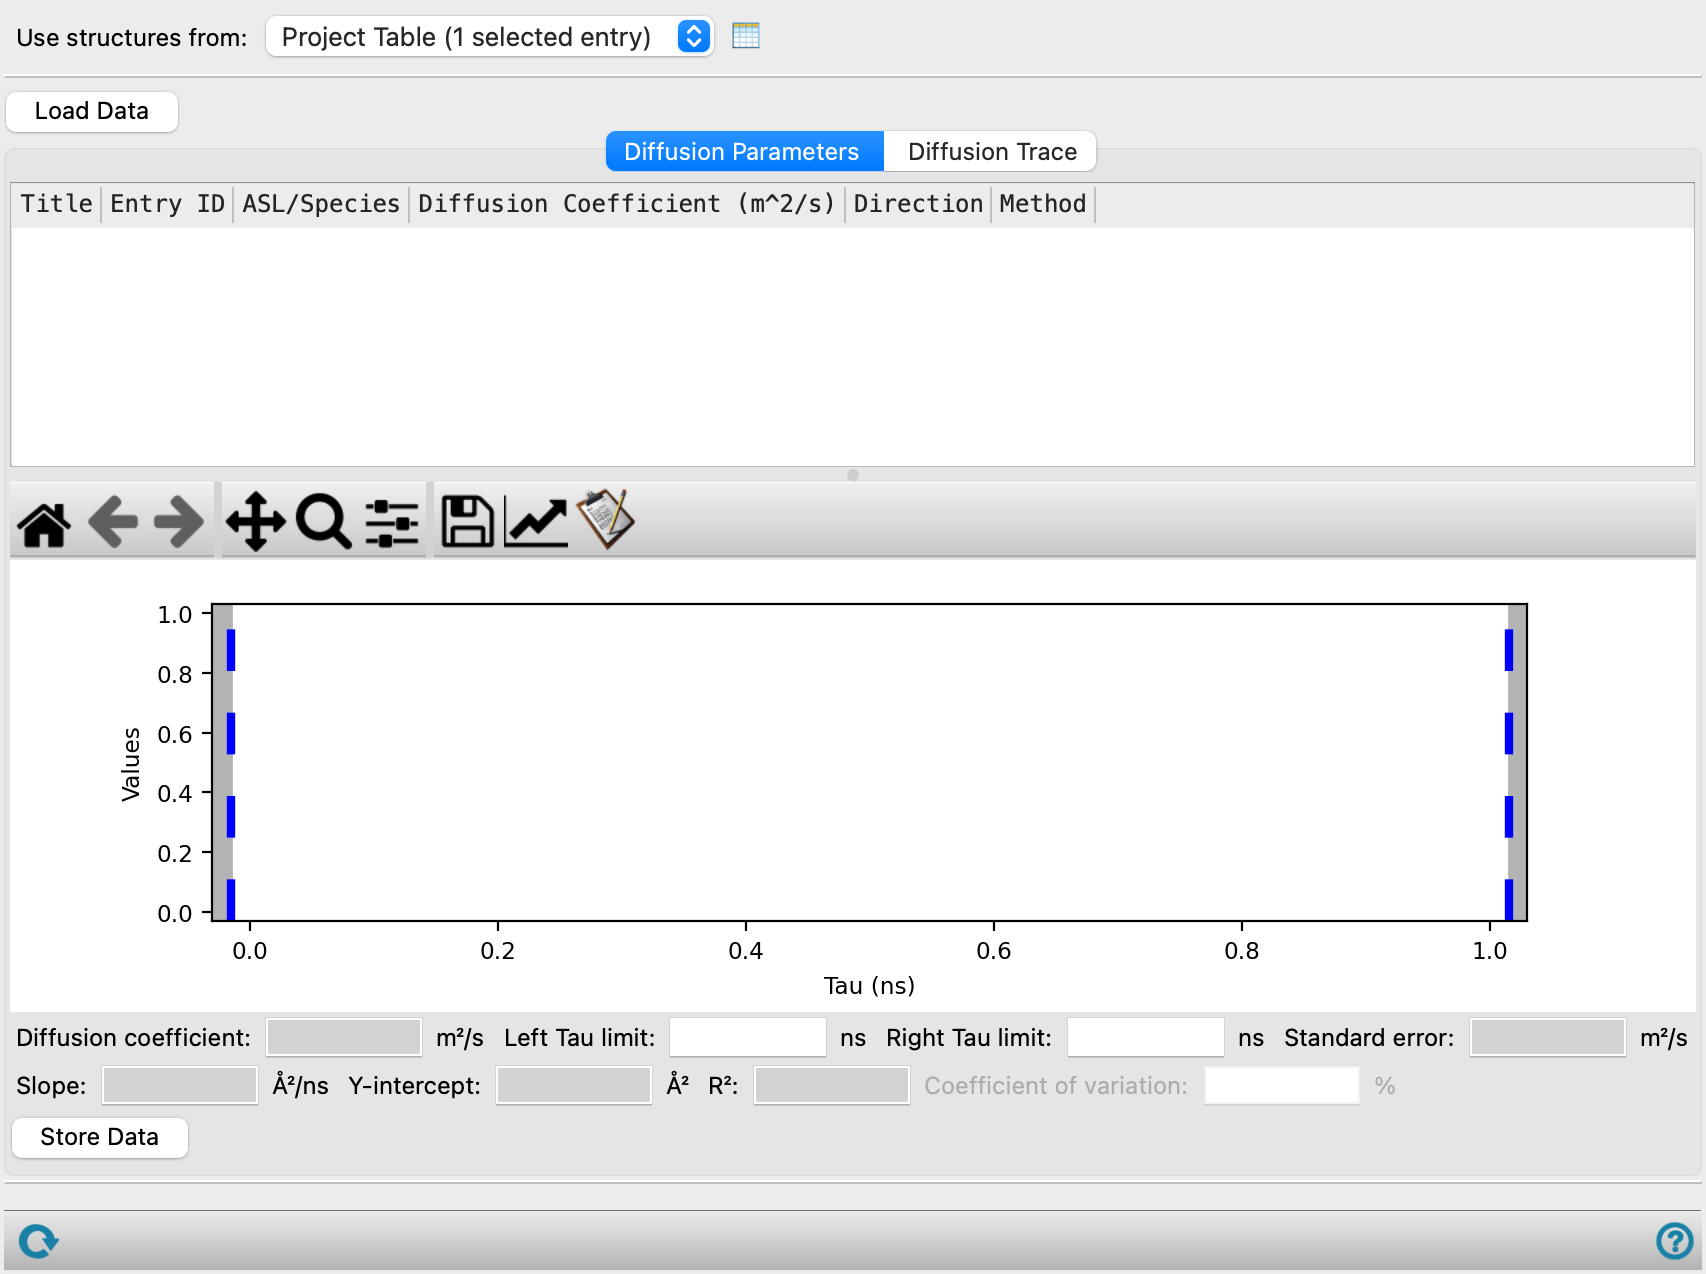
- Diffusion Parameters tab
-
Display values of diffusion coefficients and plots of the mean square distance (MSD) against simulation time difference. The fit of the MSD to obtain the diffusion coefficient can be adjusted.
- Results table
-
This table shows the results for each structure that was loaded, giving the diffusion coefficients, the species identification, the method used for the fit, and the location of the data files.
- Results plot
-
Plots the MSD against the simulation time differences tau, with controls for adjusting the fit of the MSD to calculate the diffusion coefficient.
- Plot toolbar
-
This is a standard plot toolbar, described in the Plot Toolbar topic.
- Plot area
-
Display a plot of the mean square displacement as a function of simulation time relative to the specified starting point.
The plot shows vertical blue dotted lines. These lines can be dragged in the plot area to adjust the limits used for the fit. The values in the fitting limit text boxes are updated as you drag the lines, and the diffusion coefficient is updated.
- Diffusion coefficient text box
-
This noneditable text box reports the value of the diffusion coefficient.
- Left fitting limit text box
-
Specify the lower time limit for fitting the linear portion of the graph to obtain the diffusion coefficient. The left blue line in the plot is adjusted when you change the value.
- Right fitting limit text box
-
Specify the upper time limit for fitting the linear portion of the graph to obtain the diffusion coefficient. The right blue line in the plot is adjusted when you change the value.
- Standard error/deviation text box
-
This text box reports the standard error in the fit for the mean square displacement method
- Fitting parameters text boxes
-
These text boxes report the parameters of the fit: the slope, intercept and R2 values for the mean square displacement method
- Store Data button
-
Save the current value of the diffusion coefficient and errors as properties to the project entry.
- Diffusion Trace tab
-
Display the trace of a selected object as it diffuses through the system, either as three 2D plots or a 3D plot. The trace is composed of the positions of the center of mass of the selected object, calculated for each trajectory frame and connected with straight lines. The center of mass of the selected objected is calculated from the mean square displacement. If the molecule crosses the cell boundary, the trace continues in the next cell. The plot axes represent the full range of movement in any of the Cartesian directions, and across cell boundaries.
- Entry option menu
-
Choose the entry for which to display the trace.
- Mass center text box
-
Specify the index of the diffusing object to trace. The object is the one specified under Center of mass for diffusion parameters section in the Diffusion Coefficient Panel.
- Plot type options
-
Choose an option for the type of plot.
- 2D—plot the trace projected onto the three planes, xy, xz, yz.
- 3D—plot the trace as a three-dimensional plot.
- Highlight in workspace option
-
Select this option to highlight in the workspace the atoms corresponding to the object specified in the Mass center text box. Changing the Mass center automatically updates the atoms highlighted.
- Plot toolbar
-
The toolbar has tools for manipulating the plot and for saving images. The buttons that are common to all plot toolbars are described in the Plot Toolbar topic.
- Plot area
-
This area displays the plot for the choice of plot type. You can rotate the 3D plot using the left mouse button. Other actions are available from the plot toolbar.
- Status bar
-
 to reset the panel to its default settings and clear any data from the panel.
If you can submit a job from the panel, the status bar displays information about the current job settings and status for the panel. The settings include the job name, task name and task settings (if any), number of subjobs (if any) and the host name and job incorporation setting. The job status can include messages about job start, job completion and incorporation.
The status bar also contains the Help button
 , which opens an option menu with choices to open the help topic for the panel (Documentation), launch Maestro Assistant, or if available, choose from an option menu of Tutorials. If the panel is used by one or more tutorials, hover over the Tutorials option to display a list of tutorials. Choosing a tutorial opens the tutorial topic.
Tutorials
- Diffusion
- Liquid Electrolyte Properties: Part 2
- Ab initio Molecular Dynamics Simulations of Li-ion Diffusion in Solid State Electrolytes
Quick Reference Sheets