Density of States Viewer Panel
Plot the density of states from a periodic DFT calculation as a function of energy.
To open this panel, click the Tasks button and browse to Materials → Quantum Mechanics → Quantum ESPRESSO → Density of States Viewer.
To open this panel from the entry group for the results of a Quantum ESPRESSO job .
.
The following licenses are required to use this panel: MS Maestro, Quantum Espresso Interface
- Features
- Additional Resources
Density of States Viewer Panel Features
- View results from option menu
-
Choose the structure source for displaying the density of states.
- Workspace (included entry)—Use the entry that is currently included in the Workspace. Only one entry must be included in the Workspace. When this option is selected, the Import button is displayed.
- File—Use the specified file. When this option is selected, the Browse button is displayed.
- Import button
-
Click Import to load the included entry from the Workspace into the viewer. The name of the included entry is displayed to the right of the button.
- Browse button
-
Click Browse and navigate to the file
- Open New Viewer button
-
Open a new viewer so you can display a different density of states plot.
- Open Viewer for Selected Entries button
-
Select entries in the Entry List or Project Table, then click this button to open a viewer for each entry. This allows you to view plots for related structures and data.
- Gaussian broadening text box
-
Width of the Gaussian function used to broaden the density of states plot. Only available if you loaded a
.save.qegzfile. - Recompute button
-
Recompute the plot after changing the width of the Gaussian function.
- Zero to Fermi energy option
-
Set the zero of energy on the horizontal axis to the Fermi energy. The value of the Fermi energy is reported in the status bar at the foot of the panel.
- Plot integrated DOS option
-
Plot the integrated density of states, which is the number of electrons with energy not exceeding E. The number of electrons is shown on the right side axis. Red and blue dashed lines are plotted for the integrated density of states for each spin, and the total integrated density of states is plotted as a green dashed line.
- Spin plot option menu
-
Choose an option for the spin projection to plot from this option menu.
- Both spins—Plot both spin-up and spin-down densities (blue and red solid lines)
- Spin up—Plot only the spin-up density
- Spin down—Plot only the spin-down density
- Spin density—Plot the spin density (difference between spin-up and spin-down densities)
- Mirror spins—Plot the spin-up density as a positive value, the spin-down density as a negative value, on the same plot.
- Plot toolbar
-
The toolbar has tools for manipulating the plot and for saving images. The buttons that are common to all plot toolbars are described in the Plot Toolbar topic.
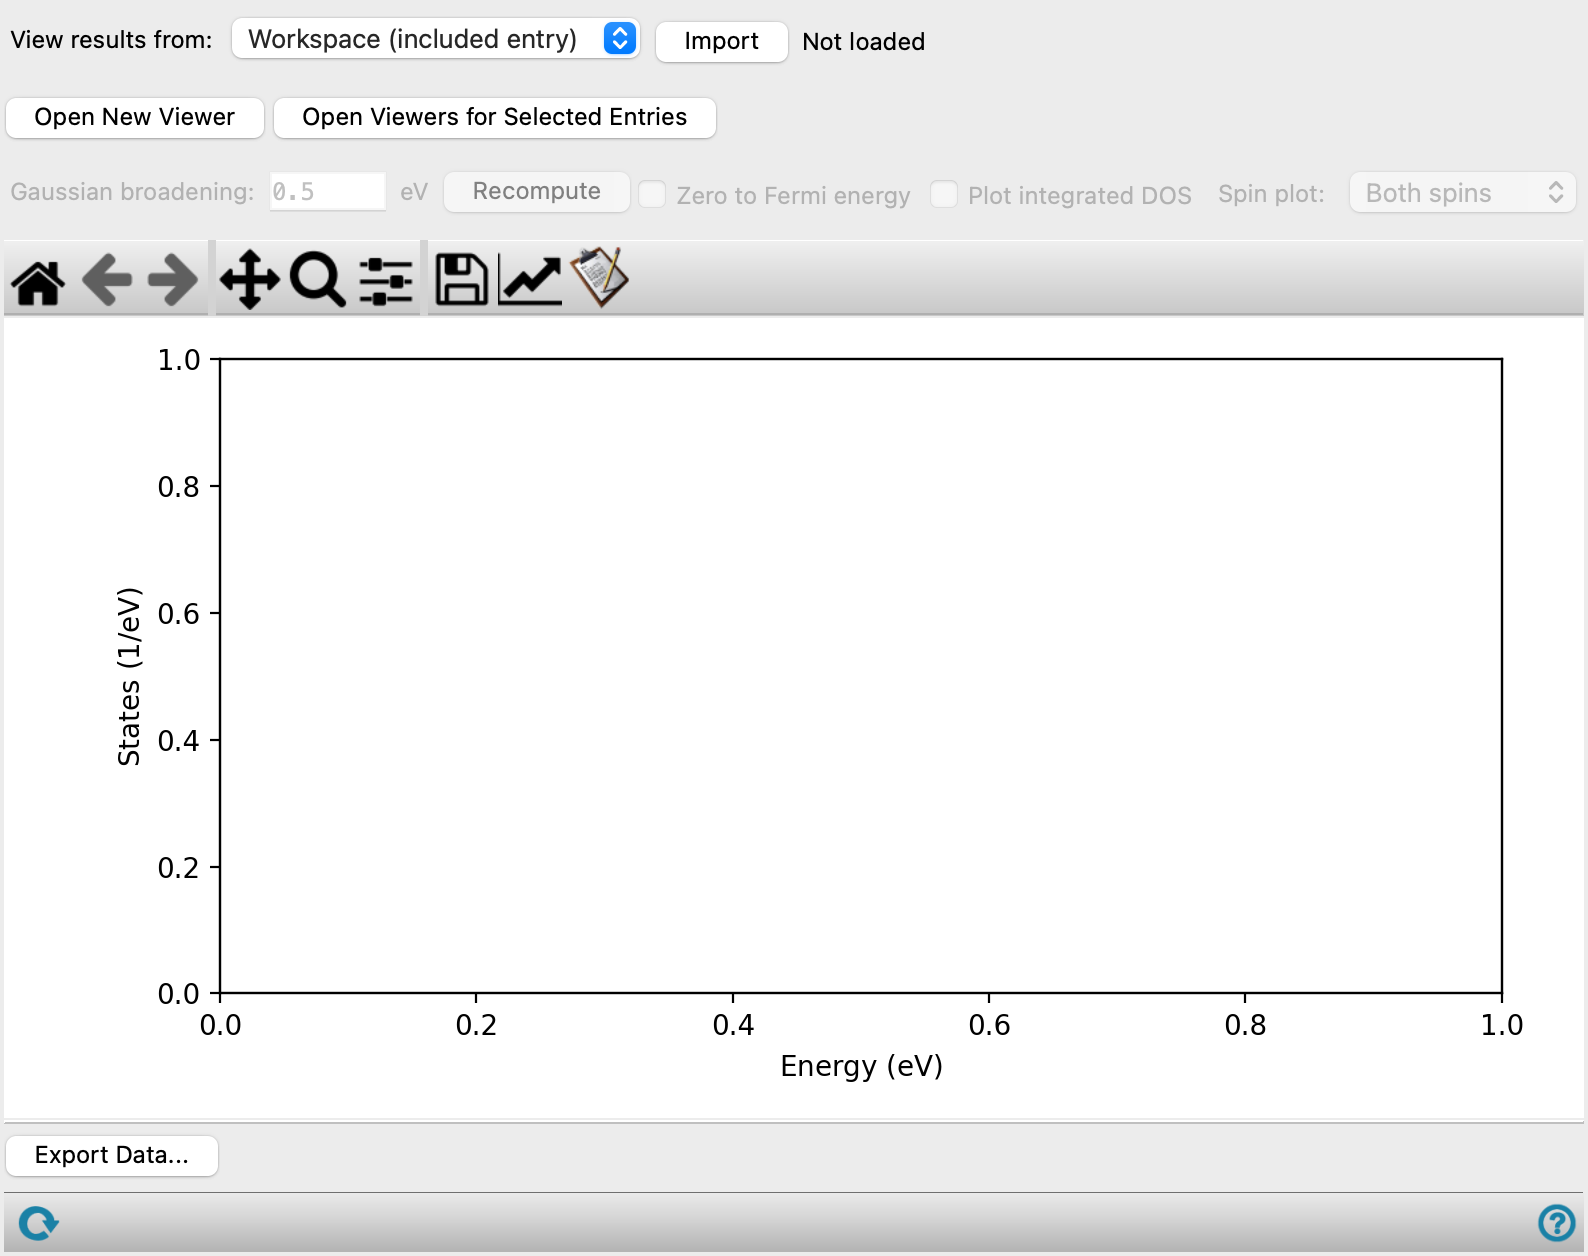
- Plot area
-
This area displays the density of states and integrated density of states (if requested) as a function of energy. Spin-up and spin-down densities and integrated densities are plotted if available, in blue and red. A black vertical line is drawn at the Fermi level.
- Export Data button
-
Export plot data to a CSV file. Opens a file selector so you can navigate to a location and name the file. The CSV file has the Fermi level on the first line, then column headings, then the densities and integrated densities as a function of energy in the columns.
- Status bar
-
 to reset the panel to its default settings and clear any data from the panel.
If you can submit a job from the panel, the status bar displays information about the current job settings and status for the panel. The settings include the job name, task name and task settings (if any), number of subjobs (if any) and the host name and job incorporation setting. The job status can include messages about job start, job completion and incorporation.
The status bar also contains the Help button
 , which opens an option menu with choices to open the help topic for the panel (Documentation), launch Maestro Assistant, or if available, choose from an option menu of Tutorials. If the panel is used by one or more tutorials, hover over the Tutorials option to display a list of tutorials. Choosing a tutorial opens the tutorial topic.