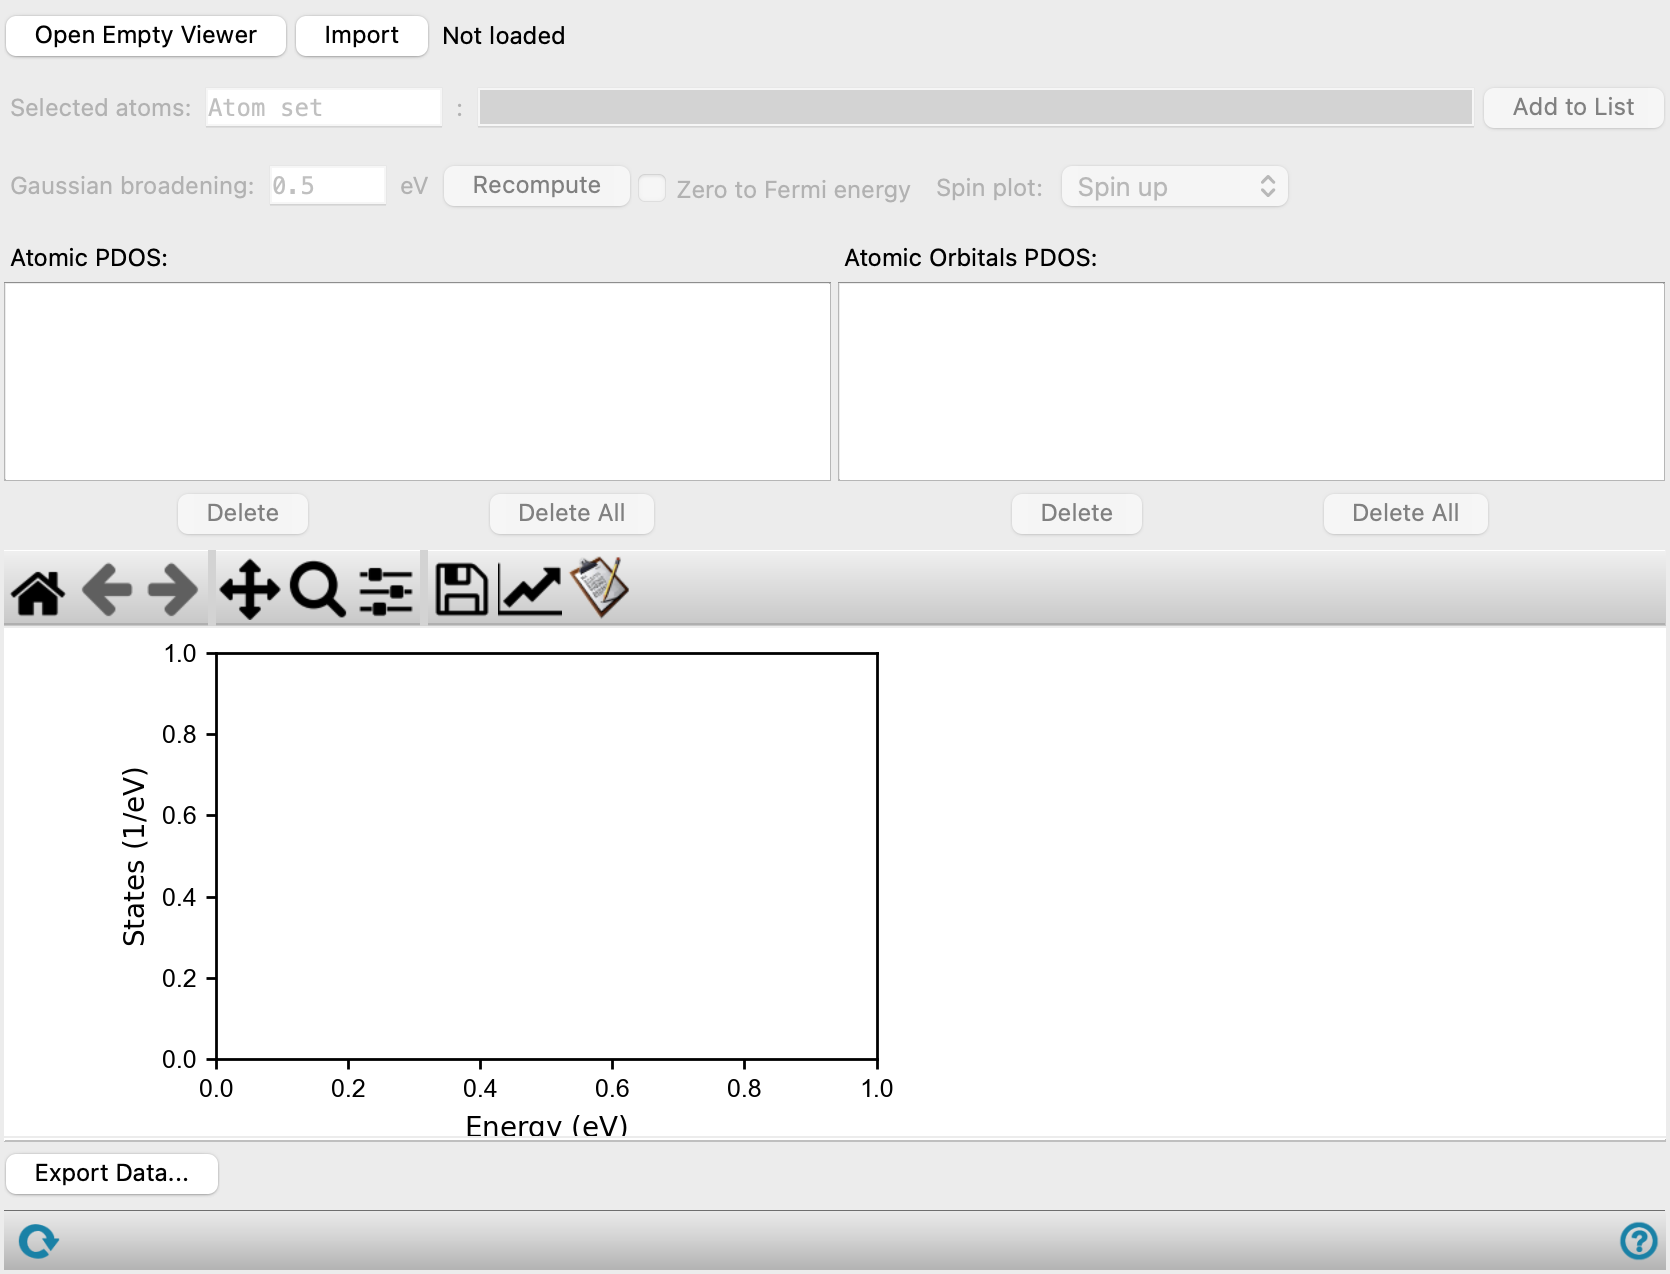
Projected Density of States Viewer Panel
Plot the projected density of states from a periodic DFT calculation as a function of energy. The density of states is projected to atoms and atomic orbitals so you can view individual and grouped contributions.
To open this panel: click the Tasks button and browse to Materials → Quantum Mechanics → Quantum ESPRESSO → Projected Density of States Viewer .
To open this panel from the entry group for the results of a Quantum ESPRESSO job .
.
The following licenses are required to use this panel: MS Maestro, Quantum Espresso Interface
- Features
- Additional Resources
Projected Density of States Viewer Panel Features
- Open Empty Viewer button
- Import button
- Selected atoms text boxes and clear button
- Add to List button
- Gaussian broadening text box
- Recompute button
- Zero to Fermi energy option
- Spin plot option menu
- Atomic PDOS list and buttons
- Atomic Orbitals PDOS list and buttons
- Plot toolbar
- Plot area
- Export Data button
- Status bar
- Open Empty Viewer button
-
Open an empty viewer so you can display a different density of states plot.
- Import button
-
Import the structure that is displayed in the Workspace into the viewer.
- Selected atoms text boxes and clear button
-
Use these tools to create sets of atoms for which to display the PDOS. The sets are created by picking atoms in the Workspace.
Enter a name for the atom set in the first text box. The name is used in the Atomic PDOS list and Atomic Orbitals PDOS list. The second text box displays the list of atoms that is selected in the Workspace, and is noneditable. The contents of this text box changes as you pick atoms in the Workspace.
- Add to List button
-
Once you have selected all the atoms you want to include in a set, and named the set, click this button to add the atom set to the Atomic PDOS list and Atomic Orbital PDOS lists.
- Gaussian broadening text box
-
Width of the Gaussian function used to broaden the density of states plot. Only available if you loaded a
.save.qegzfile. - Recompute button
-
Recompute the plot after changing the width of the Gaussian function.
- Zero to Fermi energy option
-
Set the zero of energy in the plot to the Fermi level.
- Spin plot option menu
-
Select the spin projection to show in the plots.
- Both spins—Plot both spin-up and spin-down densities
- Spin up—Plot only the spin-up density
- Spin down—Plot only the spin-down density
- Spin density—Plot the spin density (difference between spin-up and spin-down densities)
- Mirror spins—Plot the spin-up density as a positive value, the spin-down density as a negative value, on the same plot.
- Atomic PDOS list and buttons
-
List of available projections of the density of states to the atoms in the named sets. You can select multiple items with the usual shift-click and control-click. The selected PDOS are plotted in the plot area with the legend to the right.
The list is created from the atom selections you define with the Selected atoms tools. You can delete the selected items or all items from the list by using the Delete and Delete All buttons.
- Atomic Orbital PDOS list
-
List of available projections of the density of states to each orbital for the atoms in the named sets. You can select multiple items with the usual shift-click and control-click. The selected PDOS are plotted in the plot area with the legend to the right.
The list is created from the atom selections you define with the Selected atoms tools. You can delete the selected items or all items from the list by using the Delete and Delete All buttons.
- Plot toolbar
-
The toolbar has tools for manipulating the plot and for saving images. The buttons that are common to all plot toolbars are described in the Plot Toolbar topic.
- Plot area
-
This area displays the projected density of states as a function of energy. A black vertical line is drawn at the Fermi level. The legend, showing which projections are plotted and the value of the d-band center (if available), is displayed to the right of the plot. The energy spacing is fixed at 0.01 eV, and the energy window extends to three times the Gaussian broadening value beyond the smallest and largest energy levels.
- Export Data button
-
Export plot data to a CSV file. Opens a file selector so you can navigate to a location and name the file. The CSV file has the Fermi level on the first line, then column headings, then the densities and integrated densities as a function of energy in the columns.
- Status bar
-
 to reset the panel to its default settings and clear any data from the panel.
If you can submit a job from the panel, the status bar displays information about the current job settings and status for the panel. The settings include the job name, task name and task settings (if any), number of subjobs (if any) and the host name and job incorporation setting. The job status can include messages about job start, job completion and incorporation.
The status bar also contains the Help button
 , which opens an option menu with choices to open the help topic for the panel (Documentation), launch Maestro Assistant, or if available, choose from an option menu of Tutorials. If the panel is used by one or more tutorials, hover over the Tutorials option to display a list of tutorials. Choosing a tutorial opens the tutorial topic.