Evaporation Viewer Panel
Plot the results of an evaporation calculation.
To open this panel: click the Tasks button and browse to Materials → Classical Mechanics → Evaporation → Evaporation Results.
To open this panel from the entry group for the results of a job .
.
The following licenses are required to use this panel: MS Maestro
- Features
- Additional Resources
Evaporation Viewer Panel Features
- Load from Workspace button
-
Load the results from the evaporation calculation for the structure in the Workspace. If you use the Workflow Action Menu to open this panel, the results are loaded automatically. If the results can’t be located automatically, a dialog opens where you can browse to the results file
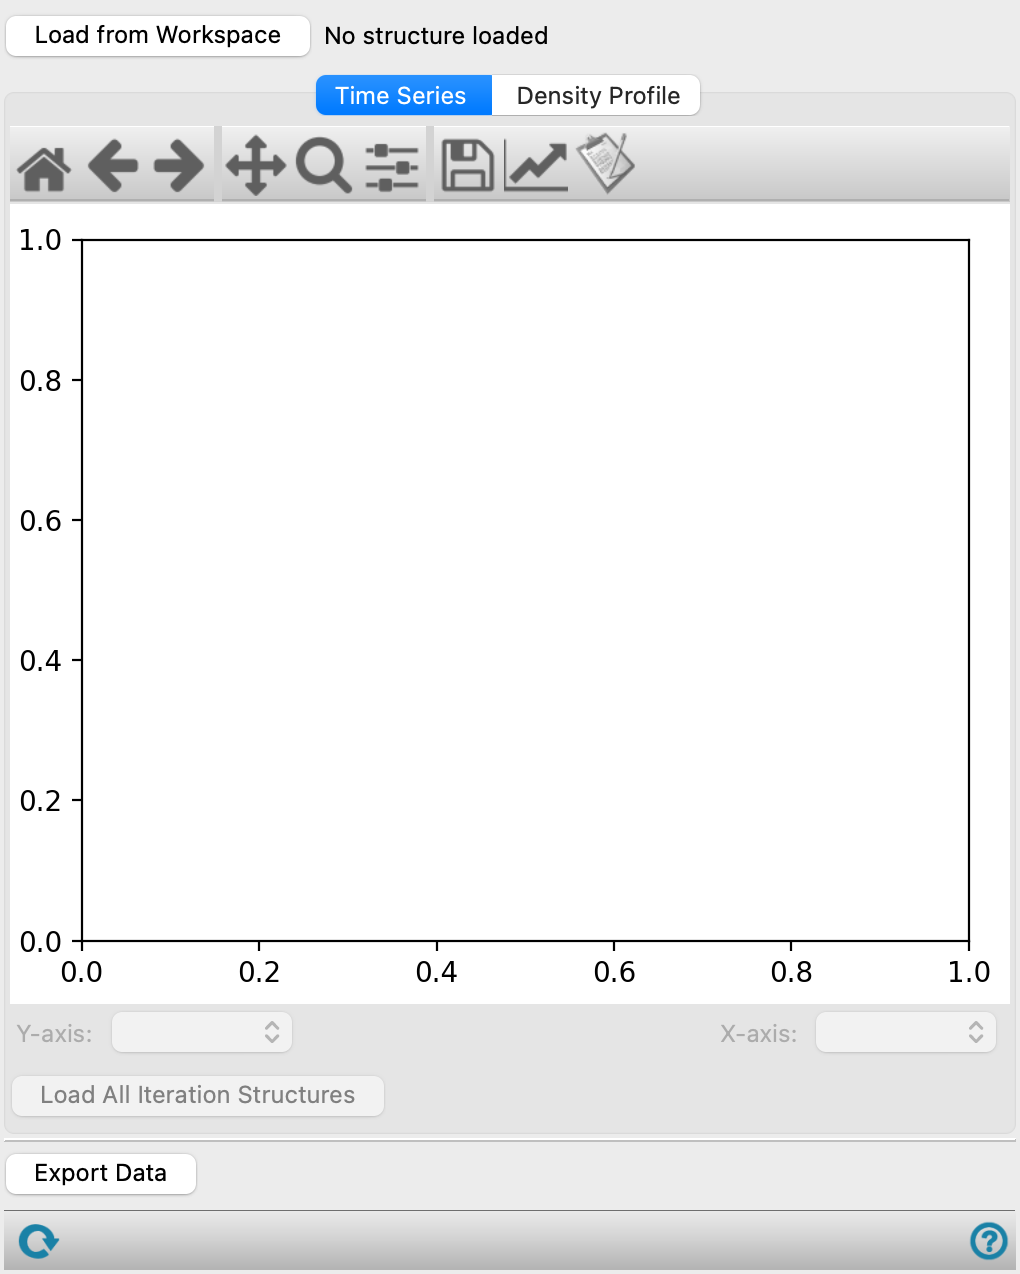
jobname_metadata.hdf5. - Time Series tab
-
Plot various values against the iteration number to visualize how they change during the evaporation process. You can choose which values to plot on the X and Y-axis, from:
- Evaporation Iteration #—The iteration number of the simulation.
- Density [g/cm3]—The density of the system.
- # Molecules Removed—The number of molecules removed at each iteration.
- Cumulative Molecules Removed—The cumulative number of molecules removed at each iteration.
- Mass Percent of {component}[%]—The mass percent of the component in the system. A menu item is shown for each component of the system.
- Plot toolbar
-
The toolbar has tools for manipulating the plot and for saving images. The buttons that are common to all plot toolbars are described in the Plot Toolbar topic.
- Plot area
-
Plot the value chosen from the Y-axis option menu against the value chosen from the X-axis option menu. Click on a data point to load and display the structure corresponding to that iteration into the Workspace.
- Y-axis option menu
-
Select a value to plot on the Y-axis. By default, Density [g/cm3] is selected.
- X-axis option menu
-
Select a value to plot on the X-axis. By default, Evaporation Iteration # is selected.
- Load All Iteration Structures button
-
Load all structures generated at each iteration of the Evaporation Panel into the Workspace. Click on a point on the Time Series plot to display the corresponding structure in the Workspace.
- Density Profile tab
-
Plot the density profile along a specified axis for different iterations to visualize how it changes for different iterations.
- Axis to plot option menu
-
Choose which axis along which density is plotted, from X-axis, Y-axis, or Z-axis.
- Plot toolbar
-
The toolbar has tools for manipulating the plot and for saving images. The buttons that are common to all plot toolbars are described in the Plot Toolbar topic.
- Plot area
-
The density is plotted against a specified axis. The iterations to display can be determined using the Iterations to plot and Number of profiles to plot text boxes. A legend at the bottom of the plot indicates the line color for a specific iteration number. If you change the display options, use the Update Plot button to updated the plot area.
- Number of profiles text box
-
Specify how many iterations to display. This determines the number of lines plotted and number of thumbs shown on the Iterations slider.
- Iterations slider
-
Set the iterations to display in the plot by using the thumbs on the slider. Right-click on the slider or a thumb to see additional options such as, Add Thumb, Remove Thumb, and a text box to specify the iteration number.
- Export Data button
-
Export data to CSV files. Opens a file selector, to name and save the files. The data includes the values from the Time Series tab (
_TimeSeries.csv) and the Density Profile for each axis (_DensityProfile_X-axis.csv,_DensityProfile_Y-axis.csv,_DensityProfile_Z-axis.csv). - Status bar
-
 to reset the panel to its default settings and clear any data from the panel.
If you can submit a job from the panel, the status bar displays information about the current job settings and status for the panel. The settings include the job name, task name and task settings (if any), number of subjobs (if any) and the host name and job incorporation setting. The job status can include messages about job start, job completion and incorporation.
The status bar also contains the Help button
 , which opens an option menu with choices to open the help topic for the panel (Documentation), launch Maestro Assistant, or if available, choose from an option menu of Tutorials. If the panel is used by one or more tutorials, hover over the Tutorials option to display a list of tutorials. Choosing a tutorial opens the tutorial topic.