Excited State Analysis Viewer Panel
Plot the results of an excited state analysis in terms of the fragments in the structure and charge transfer between the fragments.
To open this panel: click the Tasks button and browse to Materials → Quantum Mechanics → Excited State Analysis → Excited State Analysis Results.
To open this panel from the entry group for the results of a job, use the Workflow Action Menu  .
.
For a tutorial, see Excited State Analysis on the web site.
The following licenses are required to use this panel: MS Maestro
- Using
- Features
- Additional Resources
Using the Excited State Analysis Viewer Panel
The main function of the panel is to determine the nature of the charge transfer in an excited state transition. For example, in a metal complex, is the transition mostly metal-to-ligand, ligand-to-metal, or ligand-to-ligand? The calculations generate raw data that breaks down the transition density into charge transfer numbers between atoms. These can then be recombined into charge transfer numbers between fragments, and displayed graphically.
The first task is to define the fragments, in the Define Fragments tab. This can be done either by making use of the bonding in the structure, or by performing clustering on the values of the correlation matrix for charge transfer. In the first, fragments can be defined by breaking designated bonds, such as metal-ligand bonds. In the second, you can choose between two methods for clustering, to define the fragments by the similarities (or correlations) in charge transfer from the ground to the excited state for multiple transitions.
The plots show a heat map of the charge transfer between fragments for a single transition, and a bar chart of the charge transfer between fragments for all the transitions of specified spin multiplicity. The plots are mainly useful if only a few fragments are defined, and cannot be displayed if there are too many fragments (as is the case if the fragments are the atoms in a structure with more than a few atoms).
Excited State Analysis Viewer Panel Features
- Import from Workspace button
- Import from Jaguar Output File button
- Define Fragments tab
- Charge Transfer Heat Map tab
- Charge Transfer Bar Graph tab
- Status bar
- Import from Workspace button
-
Import the structure in the Workspace into the viewer. The structure must have results of a TDDFT calculation.
- Import from Jaguar Output File button
-
Import the structure and results from a Jaguar output file of a TDDFT calculation with natural transition orbitals. Opens a file selector to locate and import the file.
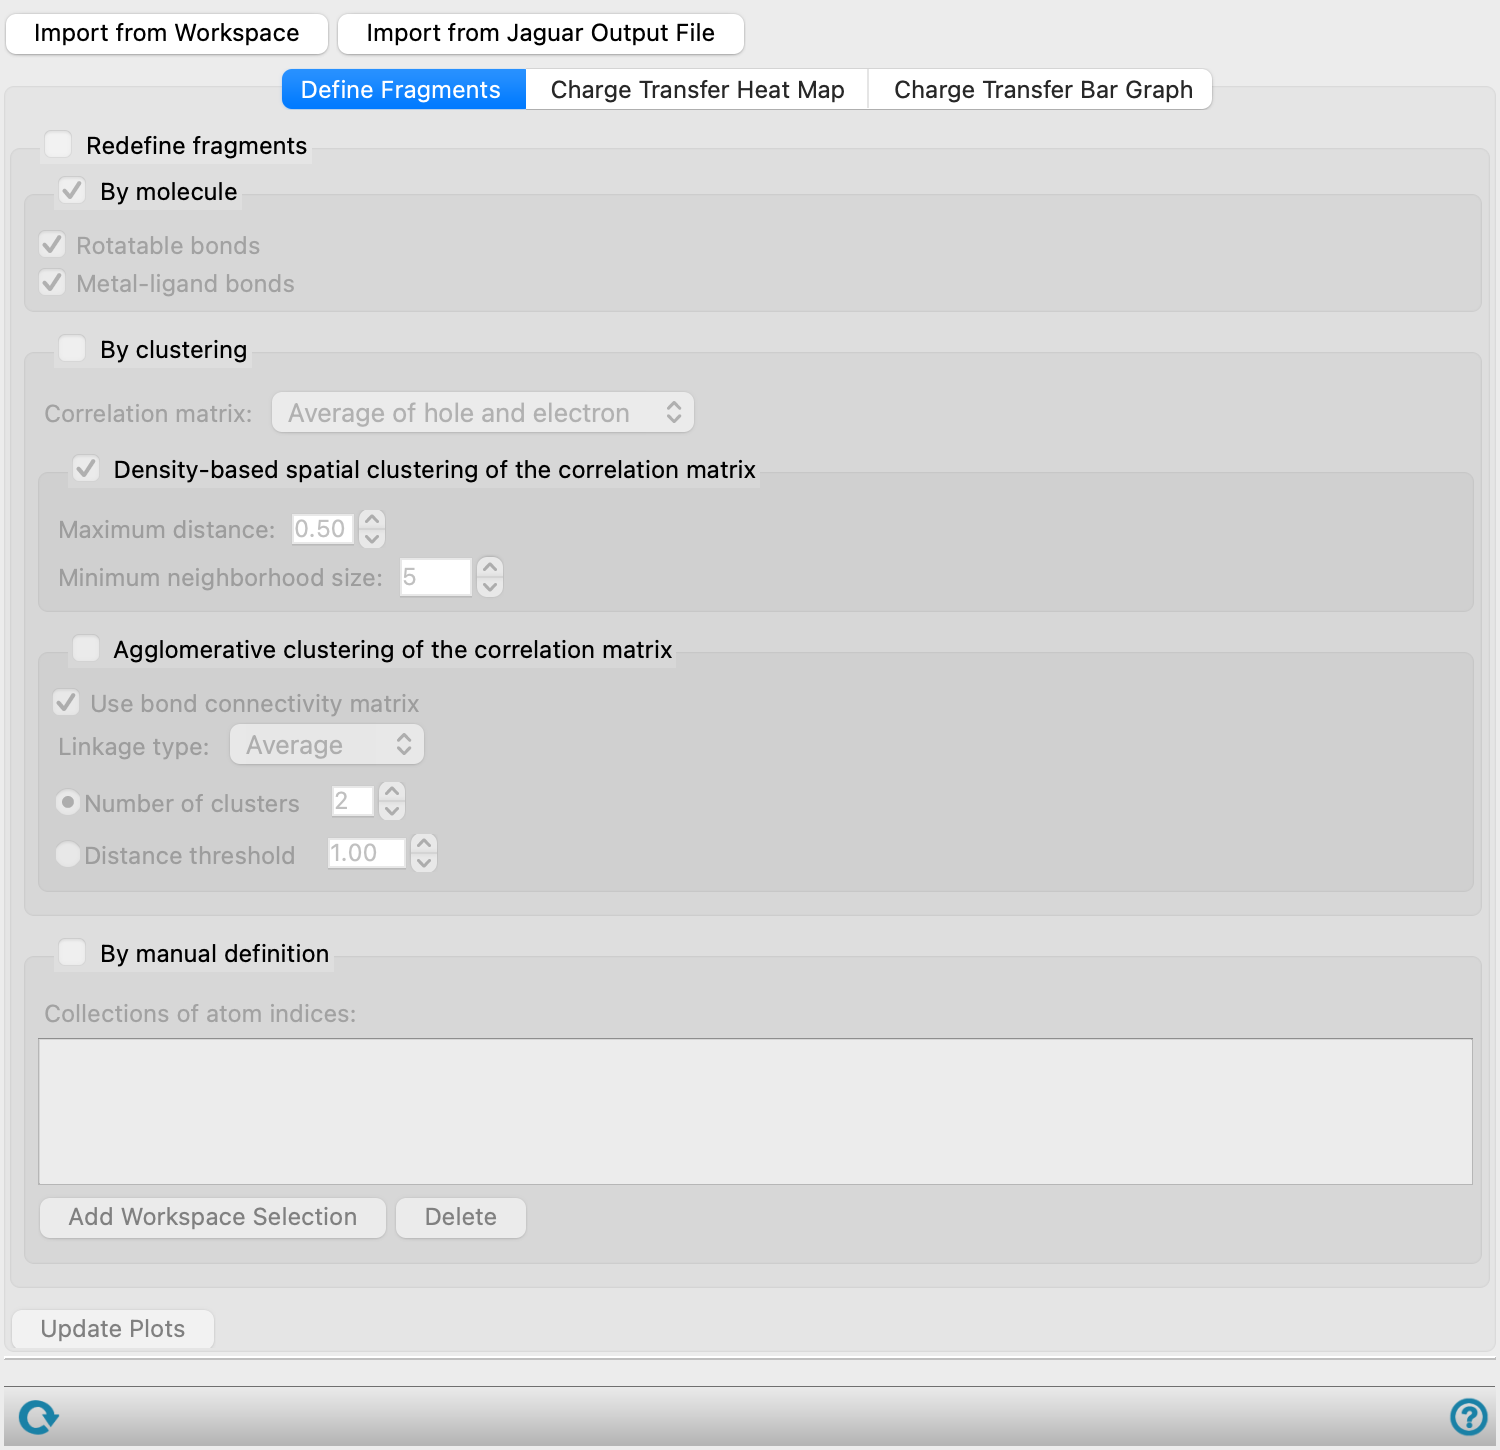
- Define Fragments tab
-
Define the fragments that are used for the analysis. By default the fragments are defined as the individual atoms, which are usually too numerous to plot.
- Redefine fragments option and section
-
Select this option to redefine the fragments.
- Connectivity based option and section
-
Define the fragments based on their connectivity. The options allow you to break molecules into fragments at specified bond types. You can select more than one option, but you do not need to select Molecules if you choose either of the other options, as molecules are taken as the starting fragments for further fragmentation.
- Molecules option
-
Each molecule is a separate fragment if this is the only option selected. If the molecule contains a metal with ligand bonds to it, the metal remains part of the molecule.
- Rotatable bonds option
-
Break each molecule in the structure into fragments at all rotatable bonds (single bonds that are not part of a ring and not to atoms that otherwise only bond to hydrogens).
- Metal-ligand bonds option
-
Break each molecule in the structure into fragments at metal-ligand bonds. The metal is its own fragment, and each ligand is its own fragment. This is useful for analysis of charge-transfer between ligands and metals in an organometallic complex.
- Cluster based option
-
Define the fragments by clustering methods based on the correlation between fragments for the transfer of charge. The purpose is to combine fragments for which there is strong correlation in the way the charge is transferred (e.g. the hole on fragment A and the hole on fragment B is transferred to the same fragments in all excited states). The methods are described in the Clustering topic of the
scikit-learncode.- Correlation matrix option menu
-
Choose the correlation matrix to use for the clustering of fragments. See Ref. 46 for definition.
-
Hole—use the correlation matrix for transfer of holes to all other fragments. Correlation of holes means that transfer of charge to other fragments from fragment A is correlated with transfer of charge from fragment B.
-
Electron—use the correlation matrix for transfer of holes to all other fragments. Correlation of electrons means that transfer of charge from other fragments to fragment A is correlated with transfer of charge to fragment B.
-
Average of hole and electron—use the average of the above two correlation matrices. This essentially looks for correlation of charge transfer in both directions.
-
- Density-based spatial clustering of the correlation matrix option and section
-
Use a density-based algorithm for finding clusters of large values (high density) in the correlation matrix.
- Maximum distance text box
-
Maximum value of the distance between two samples (data points) for the samples to be in the same cluster (
epsparameter). The size of the clusters is directly related to the value of this parameter. - Minimum neighborhood size text box
-
Minimum number of samples needed to form a cluster.
- Agglomerative clustering of the correlation matrix option and section
-
Use hierarchical agglomerative clustering to define the fragments.
- Use bond connectivity matrix option
-
Constrain the clusters so that the atoms in the cluster are contiguously bonded. In a metal complex where the metal is in its own fragment, each ligand would be in a separate fragment. So for example in a metal carbonyl complex, you would not get two CO ligands in the same cluster. However, you could get a fragment that contained the metal and one or more ligands, as the metal and ligands are considered to be bonded.
- Linkage type option menu
-
Choose a linkage method for clustering from the following:
Single Shortest distance between inter-cluster pairs. Produces diffuse, elongated clusters Complete Longest distance between inter-cluster pairs. Produces compact, spherical clusters Average Average distance between all inter-cluster pairs - Number of clusters option and text box
-
Specify the number of clusters to return. The default is 2.
- Distance threshold option and text box
-
Specify the distance threshold for merging clusters, as a value between 0 and 1. The number of clusters returned depends on the value of this threshold: a smaller value leads to a smaller number of clusters. The default is 1, which means each fragment is in its own cluster.
- Update Plots button
-
Update the plots to use the current fragment definitions. If Redefine fragments is not selected, the fragments are defined as the individual atoms, and the plots are shown for the individual atoms. A message is displayed in the status bar when the plots have been updated.
- Charge Transfer Heat Map tab
-
Display a heat map of the charge transfer between fragments for a given singlet or triplet excited state. The electron fragment is shown on the horizontal axis and the hole fragment on the vertical axis. The fragment indices are color-coded, and the fragments are colored in the Workspace with the same colors.
- Multiplicity option menu
-
Choose the spin multiplicity for the excited state to display in the heat map, from Singlet or Triplet.
- Index text box
-
Enter or choose the index of the excited state (1 for the first excited state of the given multiplicity, etc).
- Annotate cells option
-
Display the fractional contribution to the charge transfer in each cell.
- Charge Transfer Bar Graph tab
-
Display the charge transfer numbers between fragments in a bar graph. A bar is shown for each state of the selected excited-state multiplicity. Each bar consists of colored segments, whose height is proportional to the charge transfer number between the fragments that are represented by the segment. The bars are labeled with the excited state label (S1, S2, etc.), the transition energy in eV, and the oscillator strength. A legend showing the colors for each fragment pair is displayed to the right.
- Excited state multiplicity option menu
-
Choose the spin multiplicity for the excited states to display in the bar chart, from Singlet, Triplet, or Both singlet and triplet.
- Include intra-fragment characters option
-
Include contributions from charge transfer within fragments in the plot. By default, only the transfer between fragments is shown.
- Status bar
-
 to reset the panel to its default settings and clear any data from the panel.
If you can submit a job from the panel, the status bar displays information about the current job settings and status for the panel. The settings include the job name, task name and task settings (if any), number of subjobs (if any) and the host name and job incorporation setting. The job status can include messages about job start, job completion and incorporation.
The status bar also contains the Help button
 , which opens an option menu with choices to open the help topic for the panel (Documentation), launch Maestro Assistant, or if available, choose from an option menu of Tutorials. If the panel is used by one or more tutorials, hover over the Tutorials option to display a list of tutorials. Choosing a tutorial opens the tutorial topic.