Free Volume Analysis Viewer Panel
Display plots of the distribution of sizes and location of voids (free volume) in the Workspace structure or trajectory.
To open this panel: click the Tasks button and browse to Materials → Tools → Free Volume Results.
To open this panel from the entry group for the results of a free volume analysis job .
.
The following licenses are required to use this panel: MS Maestro
- Using
- Features
- Additional Resources
Using the Free Volume Analysis Viewer Panel
You can analyze the results of a calculation run from the Free Volume Analysis Panel on a structure or a trajectory, or from the Crosslink Polymers Panel with the Free volume option selected. If you want to analyze the free volume at each crosslinking step, you can import the intermediate Maestro files from a crosslinking job for viewing in this panel.
Free Volume Analysis Viewer Panel Features
- Load Data from Workspace button
- Probe radius option menu
- Grid spacing option menu
- Void statistics area
- Distribution tab
- Cumulative tab
- Location tab
- Convergence tab
- Export Data button
- Status bar
- Load Data from Workspace button
-
Read the analysis information for the Workspace structure that is used for displaying the plots. If the analysis was performed on a trajectory, you can use the trajectory viewer to step through frames, and the analysis information is automatically loaded as each frame is displayed.
- Probe radius option menu
-
Choose the probe radius from the values used in analyses performed for this structure. The Grid spacing option menu is populated with the values used for the analysis with this probe radius.
- Grid spacing option menu
-
Select the grid spacing for which to display plots of the voids.
- Void statistics area
-
Shows the total number of voids, the free volume in %, the mean and standard deviation of the void sizes in Å3 and the median void size in Å3. The numbers are updated when a different probe radius or grid spacing is selected.
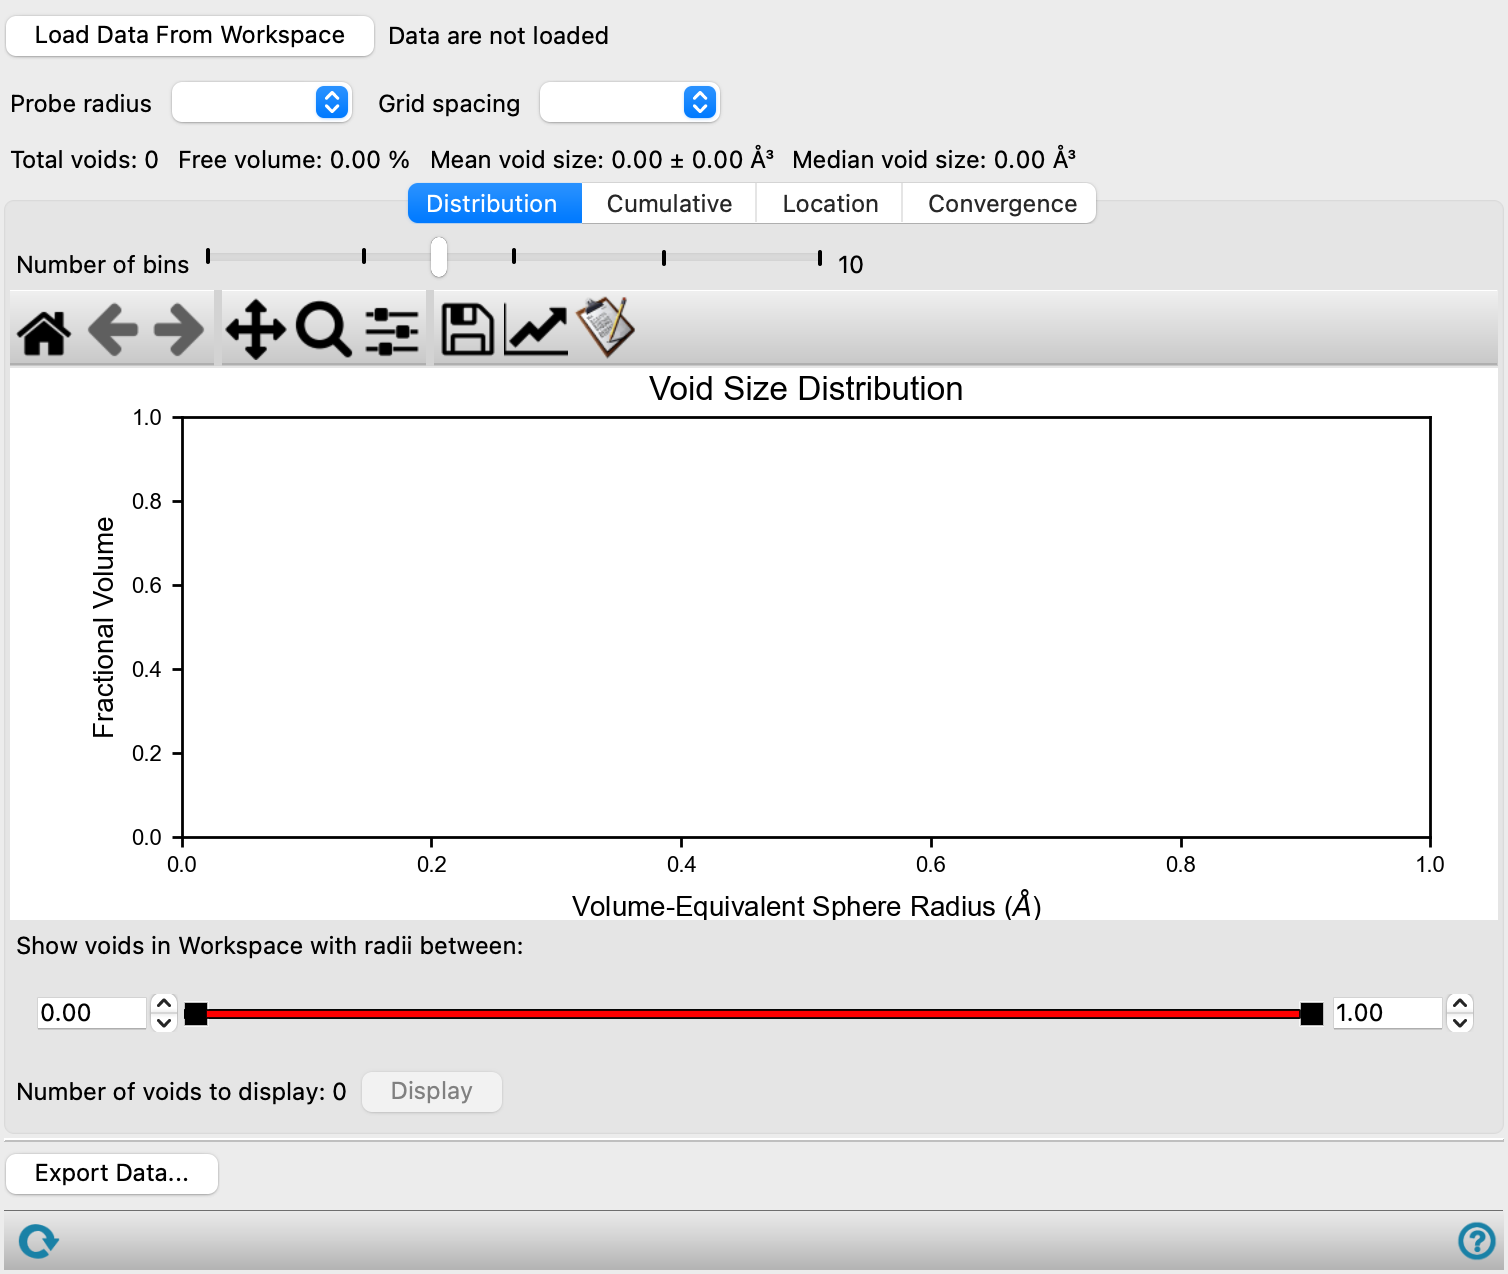
- Distribution tab
-
Displays a histogram of void sizes. The size is represented by the radius of a sphere that contains the same volume as the void.
- Number of frames option
-
Specify the number of frames for which the void size distribution is displayed. The histogram displays bars for each void size range for each frame. The frames are chosen to be as equally spaced as possible across the trajectory, while including the first and last frames.
Only present if the analysis was performed on a trajectory.
- Number of bins slider
-
Number of bins (histogram bars) to divide the void sizes into. The bins are equally spaced in the void size (radius).
- Plot toolbar
-
This is a standard plot toolbar, described in the Plot Toolbar topic.
- Plot area
-
The plot area shows a histogram of void sizes. The x axis is the void size (radius). The y axis is the fractional volume, i.e. the fraction of the overall free volume that is occupied by the voids in a bin. Multiple bars are shown for each void size if multiple frames of a trajectory were specified for display.
- Show voids in Workspace with radii between text boxes and slider
- Show voids in Workspace for current frame with radii between text boxes and slider
-
Set the range of voids to be shown in the Workspace as surfaces, for all voids in the size range specified by the slider and text boxes. The voids are shown for the structure or trajectory frame shown in the Workspace.
- Display button
-
Display the voids of the selected size range in the Workspace as pink-colored surfaces. The surfaces can be managed with the standard surface management tools, e.g. they can be shown or hidden with the Surfaces toggle on the Workspace Configuration toolbar. The number of voids in the Workspace structure or current trajectory frame (displayed in the Workspace) is shown to the left of this button.
- Precalculate All Voids button
-
Precalculate voids for all frames in the trajectory. The number of voids across all frames is shown to the left. Once the voids are calculated, the Display button is disabled, and the voids are always shown.
Only present if the analysis was performed on a trajectory.
- Cumulative tab
-
Displays a log-log plot of number of voids larger than a given size against void size (volume), for the structure or trajectory frame in the Workspace.
- Plot toolbar
-
This is a standard plot toolbar, described in the Plot Toolbar topic.
- Plot area
-
Displays the plot of number of voids as a function of void size.
- Location tab
-
Displays the location of the voids in a cross-section of the Workspace structure or frame, taken perpendicular to a coordinate axis. The cross-sections are calculated in the planes that correspond to the grid points. A plane is shown in the Workspace that indicates the location of the current cross-section.
- View along option menu
-
Choose the axis that the view is taken along (i.e. that the cross-section is perpendicular to).
- Layer display controls
-
Use the arrows to step through the cross-sections ("layers") in the direction of the current axis.
- Plot toolbar
-
This is a standard plot toolbar, described in the Plot Toolbar topic.
- Plot area
-
Displays the voids in the current cross-section. The voids are shown as colored blobs, with the color indicating a specific void. A void might have more than one blob in a given layer, depending on how it is distributed. Larger voids are reddish, smaller voids are greenish to bluish.
Clicking on a blob plots that void in the Workspace as a surface. Atoms on the surface of the void are changed to CPK rendering, atoms within 5 angstroms of the surface atoms are shown as wire frame, and all other atoms are hidden.
If the structure is the result of a polymer cross-linking calculation, the plot may also contain circles, triangles, and squares. The circles indicate the location of atoms that can be cross-linked but are not yet cross-linked, triangles indicate the location of atoms that have been cross-linked but can still be cross-linked, and the squares indicate the location of cross-linked atoms that can no longer cross-link. Their presence is controlled by the options given below.
- Crosslink atom display options and buttons
-
Select the classes of crosslink atoms to display in the plot. These options and buttons are displayed if the structure is the result of a polymer cross-linking calculation.
- Crosslinkable atoms option
-
Display atoms that are crosslinkable, but have not been crosslinked, in the plot as circles.
- Crosslinked atoms option
-
Display atoms that are crosslinked, and cannot be crosslinked further, in the plot as squares.
- Crosslinked atoms that remain crosslinkable option
-
Display atoms that are crosslinked, and can still be crosslinked further, in the plot as triangles.
- Hide all Crosslink Atoms button
-
Hide all classes of crosslink atoms. Deselects all the crosslink atom options, only available if there are selected options.
- Show all Crosslink Atoms button
-
Display all classes of crosslink atoms. Selects all the crosslink atom options, only available if there are unselected options.
- Redisplay All Atoms button
-
Click this button to redisplay all atoms. This is useful after displaying a void in the Workspace.
- Convergence tab
-
Display a plot of the convergence of the free volume as a function of the grid spacing, for the structure or trajectory frame in the Workspace.
- Free volume options
-
Select an option for the Y axis, either Percent free volume or Absolute free volume.
- Plot toolbar
-
This is a standard plot toolbar, described in the Plot Toolbar topic.
- Plot area
-
Displays the plot of the free volume as a function of the specified grid spacing.
- Export Data button
-
Export data from the displayed plot as a CSV file. Opens a file selector, to locate and name the file. Not available for the void location plot, in the Location tab.
- Status bar
-
 to reset the panel to its default settings and clear any data from the panel.
If you can submit a job from the panel, the status bar displays information about the current job settings and status for the panel. The settings include the job name, task name and task settings (if any), number of subjobs (if any) and the host name and job incorporation setting. The job status can include messages about job start, job completion and incorporation.
The status bar also contains the Help button
 , which opens an option menu with choices to open the help topic for the panel (Documentation), launch Maestro Assistant, or if available, choose from an option menu of Tutorials. If the panel is used by one or more tutorials, hover over the Tutorials option to display a list of tutorials. Choosing a tutorial opens the tutorial topic.