Plot KMC Charge Mobility Panel
Plot the charge mobility and velocity from kinetic Monte Carlo calculations against the applied field.
To open this panel: click the Tasks button and browse to Materials → Quantum Mechanics → KMC Charge Mobility → Plot KMC Charge Mobility.
To open this panel from the entry group for the results of a job .
.
The following licenses are required to use this panel: MS Maestro, MS Mobility
- Features
- Additional Resources
Plot KMC Charge Mobility Panel Features
- Use structure from option menu
- Open Project Table button
- File name text box and Browse button
- Plot options
- Charge options
- Average for fields with different signs option
- Average for fields along different axes option
- Include in averaging option menu
- Plot buttons
- Legend option
- Plot area
- Zero-field mobility table
- Status bar
- Use structure from option menu
-
Choose the structure source for plotting charge mobilities and velocities. The mobilities and velocities are stored as properties for each structure.
- Project Table (selected entry)—Use the entry that is currently selected in the Project Table. Only one entry must be selected.
- Workspace (included entry)—Use the entry that is currently included in the Workspace. Only one entry must be included in the Workspace.
- File—Use the specified file. When this option is selected, the File name text box and Browse button are displayed.
- Open Project Table button
-
Open the Project Table panel, so you can

- File name text box and Browse button
-
Enter the file name in this text box, or click Browse and navigate to the file. The name of the file you selected is displayed in the text box.
- Plot options
-
Choose the quantity to plot.
- Mobility—plot the logarithm (base 10) of the charge mobility in cm2/Vs as a function of the square root of the field strength in V/m.
- Velocity—plot the average charge velocity, in m/s, as a function of the field, in MV/m.
- Charge options
-
Plot the mobility or velocity for the selected charge carrier type (Hole or Electron)
- Average for fields with different signs option
-
Average the mobilities or velocities for fields of the same magnitude and orientation but opposite sign. This is useful for amorphous materials, where the charge mobility should be independent of the field direction. For layered or interfacial structures, you might want to deselect this option to compare mobilities in opposite directions. If you deselect this option, the mobilities or velocities are plotted for each field sign as separate series on the plot.
- Average for fields along different axes option
-
Average the mobilities or velocities for fields of the same magnitude but aligned on different axes, as chosen in the Compute KMC Charge Mobility — Advanced Options Dialog Box. The averaging is useful for amorphous materials, where the charge mobility should be independent of the field direction. For layered or interfacial structures, you might want to deselect this option to compare mobilities in different directions. If you deselect this option, the mobilities or velocities are plotted for each field direction as separate series on the plot.
- Include in averaging option menu
-
Choose the data sets to include in the averaging when the Average for fields with different signs or Average for fields along different axes options are selected. All data sets are included in the averaging by default. In cases of strong anisotropy with respect to different axes or field directions, it may be helpful to exclude certain data sets.
Only present when at least one of Average for fields with different signs or Average for fields along different axes is selected.
- Plot buttons
-
Use these buttons to configure the plot.
- Zoom In—Zoom in on the plot. Each click zooms in by a predefined factor, enlarging the view of the current center of the plot. You can also zoom in on a particular area by dragging out a rectangle.
- Zoom Out—Zoom out by a predefined factor. Each click zooms out by a predefined factor, to show more of the plot.
- Axes—Set the range and labeling options for the axes. Opens the Axes Parameters Dialog Box.
- Reset View—Reset the view of the plot to the original zoom and pan values.
- Series—Set up the appearance of the plot series, such as color, symbol, lines. Opens the Series Parameters Dialog Box.
- Copy—copy an image of the plot to the clipboard, for use in other applications.
- Legend option
-
Display a legend in the plot.
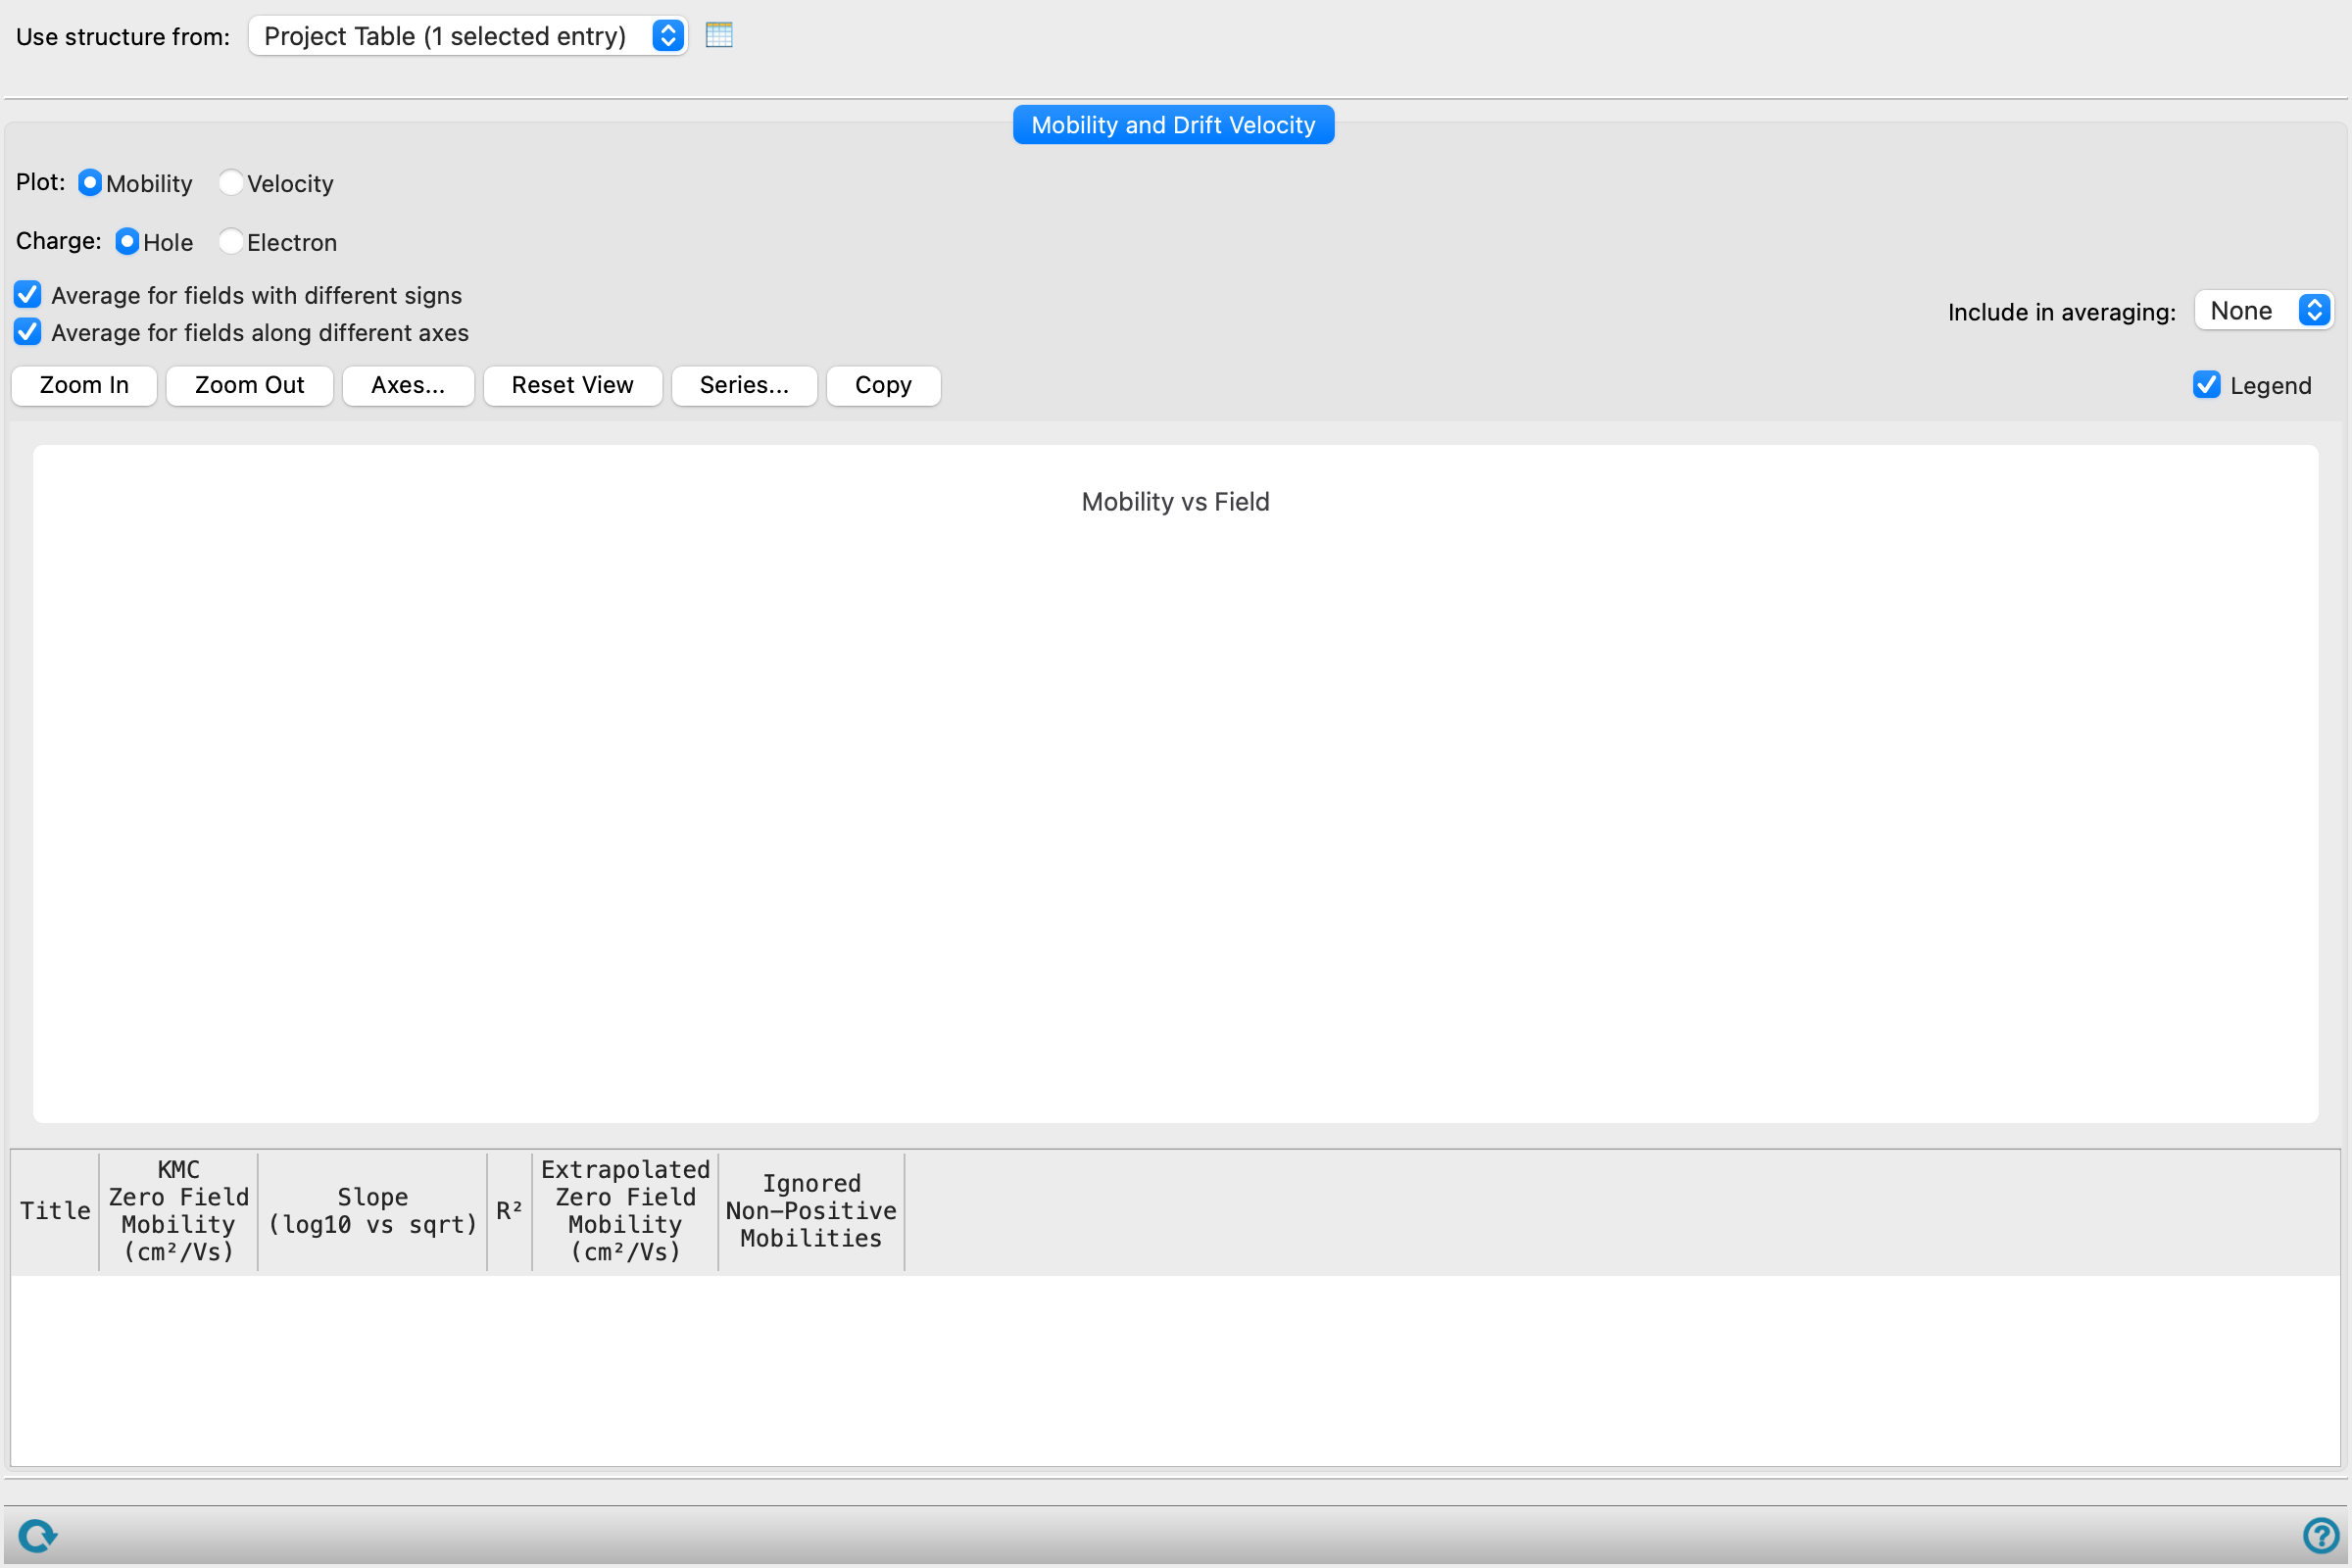
- Plot area
-
The logarithm (base 10) of the mobilities, or the velocity, is plotted against the square root of the field strength, or the field strength, in this area.
You can zoom in to an area by dragging out a rectangle.
- Zero-field mobility table
-
This table shows the data derived from the plots of charge mobility. It is not present for velocity plots.
Title Title of the plot, which is composed of the project entry title and information on the field axis and sign. KMC Zero Field Mobility (cm2/Vs) Value of the mobility from a KMC calculation at zero field, if available.2 Slope (log10 vs sqrt) Slope derived from the linear fit to the plot points for the series. R2 Correlation coefficient for the fit.2 Extrapolated Zero Field Mobility (cm2/Vs) Value of the zero-field mobility derived from the y-intercept of the fitted line.2 - Status bar
-
The status bar displays information about the current job settings and status for the panel. The settings includes the job name, task name and task settings (if any), number of subjobs (if any) and the host name and job incorporation setting. The job status can include messages about job start, job completion and incorporation.
Use the Reset button
 to reset the panel to its default settings and clear any data from the panel.
 The status bar also contains the Help button
 , which opens the help topic for the panel in your browser. If the panel is used by one or more tutorials, hovering over the Help button displays a
  button, which you can click to display a list of tutorials (or you can right-click the Help button instead). Choosing a tutorial opens the tutorial topic.