Membrane Analysis Viewer Panel
View plots of the structural properties of a lipid over the course of a molecular dynamics trajectory, generated using the Membrane Analysis panel.
To display this panel: click the Tasks button and browse to Materials → Classical Mechanics → Trajectory Analysis → Membrane Analysis Results
The following licenses are required to use this panel: MS Complex Bilayer Builder
- Features
- Additional Resources
Membrane Analysis Viewer Panel Features
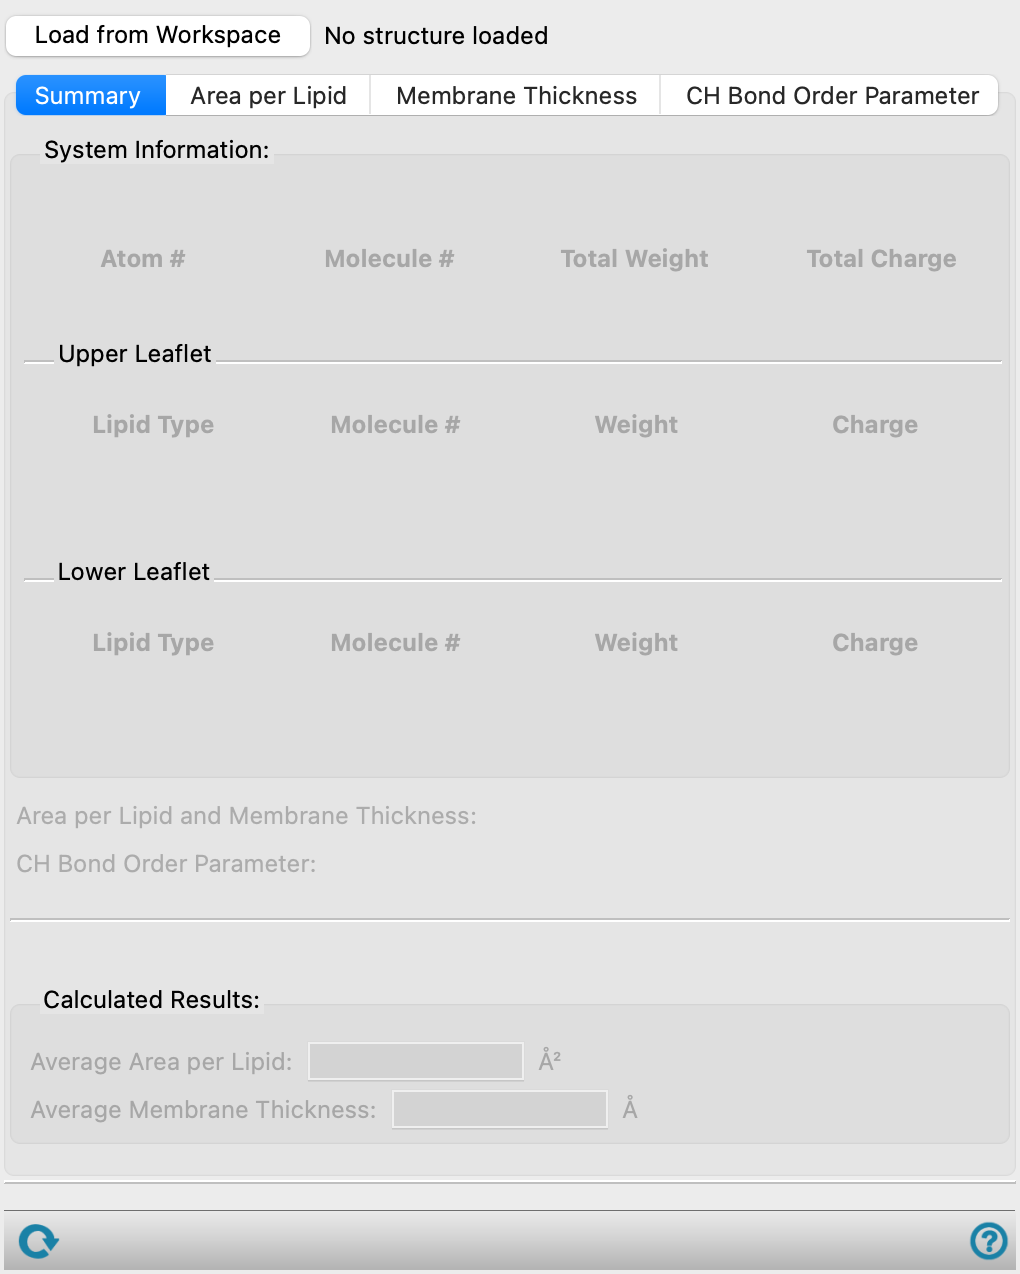
- Load from Workspace button
-
Load the data associated with the structure in the Workspace, which must be the output structure from a job run from the Membrane Analysis Panel.
- Summary tab
-
This tab displays the value of various properties in noneditable text boxes, obtained from the simulation parameters, results, and from averaging of the data.
- System Information section
-
For the loaded structure, this section provides information about the structure as a whole and the leaflets individually. For the overall structure, this section provides the name of the structure, number of atoms (Atom #), number of molecules or repeat units (Molecule #), Total Weight in atomic mass units, and Total Charge. For the upper and lower leaflets, this section provides the lipid types (Lipid Type), number of molecules for each lipid type (Molecule #), Weight of all lipids of each type in atomic mass units, and Charge.
- Area per Lipid and Membrane Thickness text
-
Displays Available if the Thickness and area per lipid option was successfully calculated from the Membrane Analysis Panel. When Not Available or Corrupted, the Area per Lipid and Membrane Thickness tabs are empty. Noneditable.
- CH Bond Order Parameter text
-
Displays Available if the CH bond order parameter option was successfully calculated from the Membrane Analysis Panel. When Not Available or Corrupted, the CH Bond Order Parameter tab is empty. Noneditable.
- Calculated Results section
-
Displays the results from the selected simulation time frame.
- Average Area per Lipid text box
-
Displays the average area per lipid in Å2. This value is calculated from averaging in the Area per Lipid tab. Changing the Block size for averaging or time values in the plot can change the averaging, and, therefore the value displayed here. Only present in the Summary and Area per Lipid tabs.
- Average Membrane Thickness text box
-
Displays the average membrane thickness, in Å. This value is calculated from averaging in the Membrane Thickness tab. Changing the Block size for averaging or time values in the plot can change the averaging, and, therefore the value displayed here. Only present in the Summary and Membrane Thickness tabs.
- Area per Lipid tab
-
Display plots of the area per lipid as a function of simulation time.
- Block size for averaging text box
-
Specify the window size for averaging, in nanoseconds. The area per lipid is averaged over each block size specified and displayed on the plot with green data points.
- Plot toolbar
-
The toolbar has tools for manipulating the plot and for saving images. The buttons that are common to all plot toolbars are described in the Plot Toolbar topic.
- Plot area
-
This area displays the plot of the area per lipid, in Å2, against simulation time, in ns. You can adjust the range of time values used for the averaging of the area per lipid by dragging the vertical dotted lines on the plot. The values in the Results for text and Average Area per Lipid text boxes are updated.
- Membrane Thickness tab
-
Display plots of the membrane thickness as a function of simulation time.
- Block size for averaging text box
-
Specify the window size for averaging, in nanoseconds. The area per lipid is averaged over each block size specified and displayed on the plot with green data points.
- Plot toolbar
-
The toolbar has tools for manipulating the plot and for saving images. The buttons that are common to all plot toolbars are described in the Plot Toolbar topic.
- Plot area
-
This area displays the plot of the membrane thickness, in Å, against simulation time, in ns. You can adjust the range of time values used for the averaging of the membrane thickness, by dragging the vertical dotted lines on the plot. The values in the Results for text and Average Membrane Thickness text boxes are updated.
- CH Bond Order Parameter tab
-
Display plots of the membrane thickness as a function of simulation time. This tab displays a plot of the bond order parameter as a function of the carbon atom on a chosen chain type.
- Lipid type to plot option menu
-
Choose the lipid type whose CH bond order parameter you want to examine. The menu contains the lipid types that were entered into the Complex Bilayer Builder Panel.
- Chain to plot option menu
-
Choose the chain type whose CH bond order parameter you want to examine. The menu contains SN1 and SN2 if the CH bond order parameter option was successfully calculated from the Membrane Analysis Panel.
- Plot toolbar
-
The toolbar has tools for manipulating the plot and for saving images. The buttons that are common to all plot toolbars are described in the Plot Toolbar topic.
- Plot area
-
This area displays the plot of of the CH bond order parameter over time for each carbon on the specified chain (SN1 or SN2) for the specified lipid. The order parameter over time is colored in grayscale, where the darkest shade (black) corresponds to the last frame in the frames slider.
- Frames slider and text boxes
-
Control the range of the trajectory over which the average order parameter is computed.
- Status bar
-
 to reset the panel to its default settings and clear any data from the panel.
If you can submit a job from the panel, the status bar displays information about the current job settings and status for the panel. The settings include the job name, task name and task settings (if any), number of subjobs (if any) and the host name and job incorporation setting. The job status can include messages about job start, job completion and incorporation.
The status bar also contains the Help button
 , which opens an option menu with choices to open the help topic for the panel (Documentation), launch Maestro Assistant, or if available, choose from an option menu of Tutorials. If the panel is used by one or more tutorials, hover over the Tutorials option to display a list of tutorials. Choosing a tutorial opens the tutorial topic.