Membrane Analysis Panel
Calculate structural properties for a lipid membrane over the selected frames of a trajectory.
To display this panel: click the Tasks button and browse to Materials → Classical Mechanics → Trajectory Analysis → Membrane Analysis Calculations
The following licenses are required to use this panel: MS Complex Bilayer Builder
- Using
- Features
- Additional Resources
Using the Membrane Analysis Panel
The input to this panel is the trajectory from an MD simulation for a lipid membrane. The lipid membrane can be built using the Complex Bilayer Builder Panel. You can run MD simulations within the Complex Bilayer Builder Panel or using the MD Multistage Workflow Panel.
It is recommended to equilibrate the lipid membrane in the NPγT ensemble with zero surface tension. Alternatively, the thermodynamically equivalent NPT ensemble with semi-isotropic pressure coupling can be used but could take longer to equilibrate.
To visualize the results, you can use the Membrane Analysis Viewer Panel (click the Tasks button and browse to Materials → Classical Mechanics → Trajectory Analysis → Membrane Analysis Results). To open this panel from the entry group for the results of a job .
.
To write out the input file and a script for running the job from the command line, click the arrow next to the Settings button  and choose Write.
Membrane Analysis Panel Features
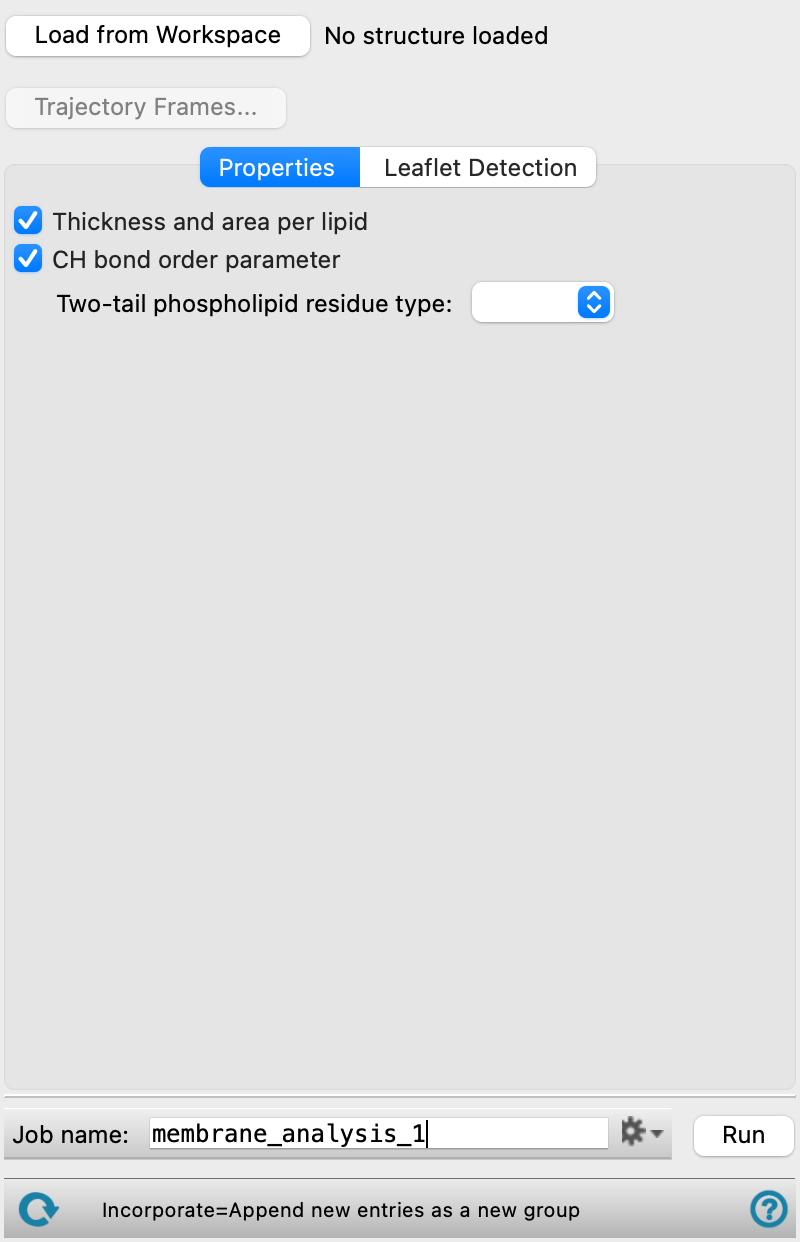
- Load from Workspace button
-
Load the trajectory associated with the structure in the Workspace. The title of the Workspace structure is shown next to this button when the trajectory has been loaded. The structure should be a well-equilibrated lipid membrane. See the Complex Bilayer Builder Panel and MD Multistage Workflow Panel for more.
- Trajectory Frames button
-
Set the range and interval of trajectory frames to use in the analysis. The total number of frames to be used and the time range (in ns) corresponding to the selected frames are shown to the right of the button. Opens the Trajectory Frames dialog box, in which you can set the following:
-
- Frame range text boxes—Set the range of frames to use. You can also use the slider to select the range.
- Step size text box—Set the interval at which trajectory frames are taken. For a step size of n, every nth frame is taken within the selected range. The first and last frames are always included. Increasing the step size decreases the number of frames to be used and the computational time needed.
- Frames text—Lists the corresponding frame numbers of the selected frame range and step size.
- Time text—Lists the corresponding time range and interval (in ns) of the selected frame range and step size.
- OK button—Apply the selected trajectory frame range and step size and close the dialog box.
- Properties tab
-
Select the properties to calculate for the loaded lipid membrane.
- Thickness and area per lipid option
-
Select this option to calculate membrane thickness and area per lipid over the trajectory. The bilayer thickness is defined as the difference between the average height of head groups in each leaflet. The area per lipid is the area of the membrane plane occupied by a single lipid molecule within the bilayer, and it is a parameter that is specific to membrane structure and composition.
- CH bond order parameter option
-
Select this option to calculate the SN1 and SN2 order parameters for two-tail phospholipids.
- Leaflet Detection tab
-
Specify the method of leaflet identification for the calculation and corresponding parameters.
- Axis normal to the membrane option menu
-
Select the axis normal to the membrane in the loaded structure.
- Find hydrophilic and hydrophobic atoms option
-
Detect the leaflets from the position of the hydrophilic atoms with respect to the midplane of the structure, where the midplane is the average position of the hydrophobic atoms with respect to the Axis normal to the membrane selected.
- Find automatically button
-
Click to populate the Hydrophilic atoms and Hydrophobic atoms sections. When using an output of the Complex Bilayer Builder Panel, these sections are successfully populated. If the system is built without that panel, the panel tries to guess an ASL for the atoms; if that fails, the atoms must be manually defined.
- Hydrophilic atoms section
-
This section contains a standard set of picking tools that you can use to select head group atoms for analysis. Molecules with matches are considered lipids and the matched hydrophilic atoms are considered head groups. Bilayer thickness is calculated as the difference between the average height of head groups in each leaflet.
- Hydrophobic atoms section
-
This section contains a standard set of picking tools that you can use to select tail group atoms for analysis.
- Show in Workspace option
-
Choose this option to select the atoms specified above in the Workspace and display them in CPK representation.
- Use lipid orientation option
-
Detect the leaflets using lipid proximity and orientations. Two lipids are considered neighbors if the distance between their head groups is less than the Distance cutoff and the cosine of the angle between their head-to-tail orientation vectors is greater than the cosine of the Tilt angle.
- Hydrophilic atoms section
-
This section contains a standard set of picking tools that you can use to select head group atoms for analysis. Molecules with matches are considered lipids and the matched hydrophilic atoms are considered head groups. Bilayer thickness is calculated as the difference between the average height of head groups in each leaflet.
- Tilt angle text box
-
Specify the maximum angle between two lipids for them to be considered oriented in the same direction. Lower values correspond to stricter neighbor requirements.
- Distance cutoff text box
-
Specify the maximum distance between two head groups for them to be considered neighbors, in Angstrom.
- Job toolbar
-
Manage job submission and settings. See Job Toolbar for a description of this toolbar.
The Job Settings button opens the Membrane Analysis - Job Settings Dialog Box, where you can make settings for running the job.
- Status bar
-
 to reset the panel to its default settings and clear any data from the panel.
If you can submit a job from the panel, the status bar displays information about the current job settings and status for the panel. The settings include the job name, task name and task settings (if any), number of subjobs (if any) and the host name and job incorporation setting. The job status can include messages about job start, job completion and incorporation.
The status bar also contains the Help button
 , which opens an option menu with choices to open the help topic for the panel (Documentation), launch Maestro Assistant, or if available, choose from an option menu of Tutorials. If the panel is used by one or more tutorials, hover over the Tutorials option to display a list of tutorials. Choosing a tutorial opens the tutorial topic.