Formulation Machine Learning Optimization Panel
Apply machine learning models for optimizing the formulation of a mixture.
To display this panel: click the Tasks button and browse to Materials → Informatics → Formulation Machine Learning Optimization
The following licenses are required to use this panel: MS Maestro, MS Formulation ML, MS Informatics (optional), (Deep)AutoQSAR
- Using
- Features
- Additional Resources
Using the Formulation Machine Learning Optimization Panel
The Formulation Machine Learning Optimization Panel can be used to apply machine learning (ML) models to optimize the formulation of a mixture for desired target properties. Formulations are defined as a mixture of multiple chemical species with a composition ratio for each ingredient/component. Simple formulations consist of single chemical species with composition ratio of each species. In contrast, complex formulations are mixtures of simple formulations such that the composition of each simple formulation can be varied, which is often found in real-world formulation design. Alternative to traditional experimental methods and physics-based simulations, machine learning models from the Formulation Machine Learning Panel can be used to map ingredient structure and composition to formulation properties. These ML models are used in this panel to suggest formulations that achieve high multiparameter optimization (MPO) scores, where each individual target property can be maximized, minimized, or focused at a particular target region. The MPO score aggregates the scores of individual target properties using a geometric mean, where a value of 1 indicates the formulation achieves the desired target properties, and a value of 0 means the converse. This panel employs various optimization approaches, such as brute force and Bayesian optimization.
The inputs for this panel are CSV file(s) containing structural and composition information about the ingredients of interest and ML model(s) trained using the Formulation Machine Learning Panel. Formulation datasets can be generated by extracting literature data, performing experiments, or performing physics-based simulations.
The CSV file(s) must contain a specific set of headers to be compatible with the panel.
For simple formulations,
SMILES,REQUIRED,GROUP,MIN_NUM_COMPONENTS,MAX_NUM_COMPONENTS
CC1COC(=O)O1,False,Solvent,1,2
C1COC(=O)O1,False,Solvent,1,2
FC(F)COCCOCC(F)(F),TRUE,Solvent,1,2
FS([N-]S(F)(=O)=O)(=O)=O.[Li+],False,Salt,1,1
-
SMILES — the ingredient structure represented by the Simplified Molecular Input Line Entry System (SMILES) notation. For example, methane is represented as “C”.
-
REQUIRED — either TRUE or FALSE, where TRUE means this ingredient must always be in the formulation. For example, if water is an important ingredient to the formulation, then setting REQUIRED to TRUE ensures that the suggested formulations always contain water.
-
GROUP — the group that the ingredient belongs in. For example, “solvent”, “polymer”, “additives”, and so on.
-
MIN_NUM_COMPONENTS — the minimum number of components desired from a group. For example, a value of “1” for a “solvent” group means you want at least one solvent ingredient in the formulation.
-
MAX_NUM_COMPONENTS — the maximum number of components desired from a group. For example, a value of “3” for a “solvent” group means you want at maximum of three solvents in the formulation.
-
MIN_PERCENT_COMPOSITION — a composition constraint that specifies the minimum composition of an ingredient.
-
MAX_PERCENT_COMPOSITION — a composition constraint that specifies the maximum composition of an ingredient.
-
STEP_SIZE (optional) — the step size to increment the composition of an ingredient between the specified minimum and maximum composition. This is used when the Brute Force algorithm is selected and useful when compositions of ingredients need to be constrained.
A column titled LABEL can optionally be used in addition to the SMILES columns. The panel supports specifying ingredients using either designation. Note that it is necessary to put a value of "MISSING" in place of any missing SMILES string in the CSV to use the corresponding descriptive label from the LABEL column.
For complex formulations two CSV files are required.
The first CSV file requires the same headers as the input for a simple formulation; however, the SMILES column is replaced with the COMPONENT column, which is now an identifier for the simple formulation instead of a SMILES structure.
COMPONENT,REQUIRED,GROUP,MIN_NUM_COMPONENTS,MAX_NUM_COMPONENTS,MIN_PERCENT_COMPOSITION,MAX_PERCENT_COMPOSITION,STEP_SIZE
water,TRUE,water,1,1,60,90,1
arlypon_f,FALSE,thickener,1,1,1,10,1
comperlan_100,FALSE,thickener,1,1,1,10,1
texapon_sb_3_kc,FALSE,surfactant,1,1,6,15,1
The second CSV file must specify the ingredient structures for each simple formulation that were labeled in the COMPONENT column of the previous file
SMILES,COMPOSITION,COMPONENT
O,100,water
CCCCCCCCCCCCCCOCCOCCO,90.5,arlypon_f
O,9.5,arlypon_f
CCCCCCCCC=CCCCCCCCC(=O)NCCO,12.5,comperlan_100
CCCCCCCCCCCC(=O)OC,2,comperlan_100
NCCO,2,comperlan_100
O,83.5,comperlan_100
CCCCCCCCCCCCOCCOCCOCCOC(=O)C(CC(=O)[O-])S(=O)(=O)[O-].[Na+].[Na+],36,texapon_sb_3_kc
O,63.1,texapon_sb_3_kc
C/C=C/C=C/C(=O)[O-].[K+],0.5,texapon_sb_3_kc
OC(=O)CC(O)(CC(=O)O)C(=O)O,0.4,texapon_sb_3_kc
-
SMILES — the ingredient structure. Note that a column titled LABEL can optionally be used in addition to the SMILES columns. The panel supports specifying ingredients using either designation. Note that it is necessary to put a value of "MISSING" in place of any missing SMILES string in the CSV to use the corresponding descriptive label from the LABEL column.
-
COMPOSITION — the percentage of the ingredient in the mixture. The compositions must sum up to 100% for each unique mixture.
-
COMPONENT — the identifier of the mixture that the ingredient belongs to, which should match the COMPONENT name in the first CSV file.
To see a complete example, please see the Optimization of Formulations Using Machine Learning tutorial.
To write out the input file and a script for running the job from the command line, click the arrow next to the Settings button  and choose Write.
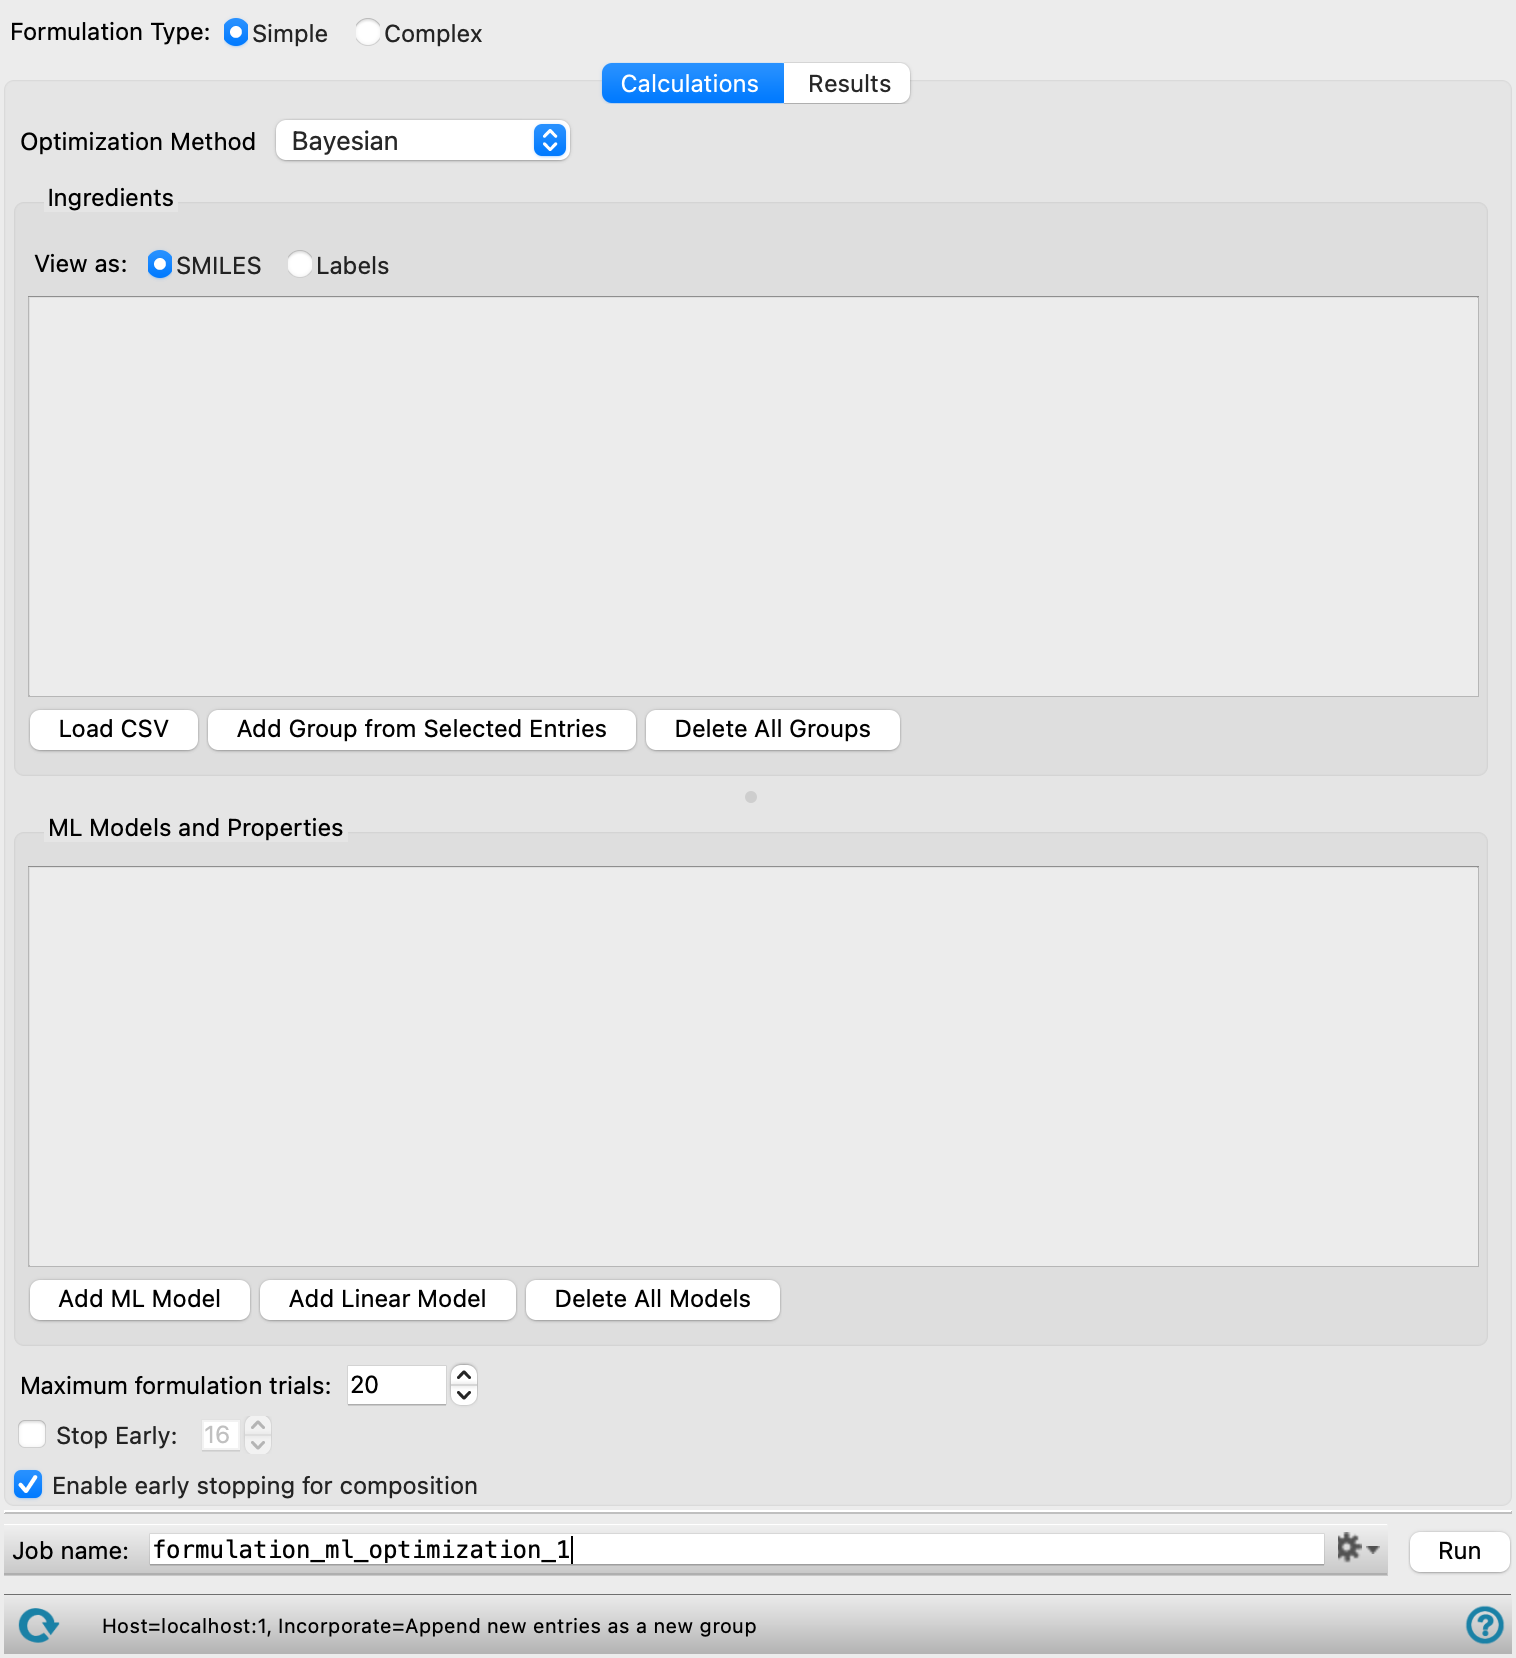
Formulation Machine Learning Optimization Panel Features
- Formulation Type options
- Calculations tab
- Optimization Method option menu
- Ingredients section
- Load CSV button
- Add Group from Selected Entries button
- Delete All Groups button
- ML Models and Properties section
- Add ML Model button
- Add Linear Model button
- Delete All Models button
- Maximum formulation trials text box
- Maximum generations text box
- Stop Early option and text box
- Enable early stopping for composition option
- Genetic Algorithm Parameters section
- Results tab
- Job toolbar
- Status bar
- Formulation Type options
-
Select a formulation type to optimize using this panel. The options include:
-
Simple—A mixture of multiple chemical species with a composition ratio for each component. A CSV file is loaded with information relevant to the formulation. See the Using the Formulation Machine Learning Optimization Panel section for more information.
-
Complex—A blend of multiple mixtures, where each mixture consists of ingredient structure and compositions. Composition ratios are specified at two levels: between the different mixtures in the blend, and among the individual chemical species within each mixture. Two CSV files are loaded with information relevant to the formulation. See the Using the Formulation Machine Learning Optimization Panel section for more information.
-
- Calculations tab
-
Load, view, and edit input ingredient data, ML models for formulation-property predictions, and selecting desired target criteria (e.g. minimize).
- Optimization Method option menu
-
Select a method to use in optimizing the formulation. The options include:
-
Bayesian—A sequential learning approach that iteratively trains a Gaussian Process model to guide and identify optimal formulations.
-
Brute Force—A grid search-based method which supports exhaustive enumeration within a set of composition constraints.
-
Random—An approach that randomly shuffles the list of possible formulation and identifies optimal formulations. This differs from Brute Force optimization such that composition optimization is performed with differential evolution rather than brute force, which can lead to faster results.
-
Genetic algorithm—Evolutionary algorithm that selects the best formulations using natural selection principles.
-
- Ingredients section
-
In this section, you specify the ingredients to use in the formulation. The ingredients and their corresponding parameters are populated using the Load CSV and Add Group from Selected Entries buttons and can be further edited in this section. Each required component or group is represented by a row. Marking a row as a required component ensures that it will be present in each formulation output by the panel. Use the (
 ,
,  ) icon to toggle whether or not a component is required in the formulations. The remaining formulation components are selected from the group rows. Each group row specifies the number of components available for selection, the chemical composition of each of those components, and options to specify the number of components to use from the group. Click on the expand icon (
 ) to show each component in the group. Click on the component to view its chemical structure, or in the case of complex formulations, the chemical composition. For simple formulations, click on a component to edit its structure and click the add icon (
 ) to add an additional component to a group. Composition constraints such as minimum and maximum percent composition of the component to use in the formulation and the step size with which to increase the percent composition by can be specified for individual components.
- View ingredients as options
-
Select how to view ingredients in the formulations input table. The options include:
-
SMILES—List each ingredient as a SMILES string. For non-missing or invalid SMILES, the structures will be editable.
-
Labels—List each ingredient with its label. The structures are not editable in this representation of the ingredients.
-
- Load CSV button
-
Load a CSV file with input ingredient data. Click to open the Select CSV file with components dialog box, where you can navigate to the file. The name of the file you selected is displayed in the text box. This CSV file is copied into the job directory as
jobname_optimization_input.csv. For complex formulations, the Select CSV file with component definitions dialog box is used to specify the second CSV file.The CSV file(s) must contain a specific set of headers to be compatible with the panel.
For simple formulations,
-
SMILES — the ingredient structure represented by the Simplified Molecular Input Line Entry System (SMILES) notation. For example, methane is represented as “C”.
-
REQUIRED — either TRUE or FALSE, where TRUE means this ingredient must always be in the formulation. For example, if water is an important ingredient to the formulation, then setting REQUIRED to TRUE ensures that the suggested formulations always contain water.
-
GROUP — the group that the ingredient belongs in. For example, “solvent”, “polymer”, “additives”, and so on.
-
MIN_NUM_COMPONENTS — the minimum number of components desired from a group. For example, a value of “1” for a “solvent” group means you want at least one solvent ingredient in the formulation.
-
MAX_NUM_COMPONENTS — the maximum number of components desired from a group. For example, a value of “3” for a “solvent” group means you want at maximum of three solvents in the formulation.
-
MIN_PERCENT_COMPOSITION — a composition constraint that specifies the minimum composition of an ingredient.
-
MAX_PERCENT_COMPOSITION — a composition constraint that specifies the maximum composition of an ingredient.
-
STEP_SIZE (optional) — the step size to increment the composition of an ingredient between the specified minimum and maximum composition. This is used when the Brute Force algorithm is selected and useful when compositions of ingredients need to be constrained.
A column titled LABEL can optionally be used in addition to the SMILES columns. The panel supports specifying ingredients using either designation. Note that it is necessary to put a value of "MISSING" in place of any missing SMILES string in the CSV to use the corresponding descriptive label from the LABEL column.
For complex formulations two CSV files are required.
The first CSV file requires the same headers as the input for a simple formulation; however, the SMILES column is replaced with the COMPONENT column, which is now an identifier for the simple formulation instead of a SMILES structure.
The second CSV file must specify the ingredient structures for each simple formulation that were labeled in the COMPONENT column of the previous file:
-
SMILES — the ingredient structure. Note that a column titled LABEL can optionally be used in addition to the SMILES columns. The panel supports specifying ingredients using either designation. Note that it is necessary to put a value of "MISSING" in place of any missing SMILES string in the CSV to use the corresponding descriptive label from the LABEL column.
-
COMPOSITION — the percentage of the ingredient in the mixture. The compositions must sum up to 100% for each unique mixture.
-
COMPONENT — the identifier of the mixture that the ingredient belongs to, which should match the COMPONENT name in the first CSV file.
See the Using the Formulation Machine Learning Optimization Panel section for more information.
-
- Add Group from Selected Entries button
-
Import the selected entries in the Project Table as a single group and name it. A set of ingredient tools to define the group parameters is added. Only present when Simple is selected for the Formulation Type.
- Delete All Groups button
-
Remove all groups from the Ingredients section.
- ML Models and Properties section
-
In this section, specify the ML models, linear models, and target property parameters for the optimization. In formulations, there are often multiple properties that need to be considered at the same time. Multi-property optimization (MPO) is utilized in order to easily identify formulations that satisfy multiple target criteria. For more information on MPO, please see An Overview of Multi-Property Optimization (MPO).
Add models using the Add ML Model or Add Linear Model button. The ML models must be generated using the Formulation Machine Learning Panel.
- Model option
-
Select the model for use in the optimization calculation.
- Model text
-
Displays the name of the loaded model.
- Model Type text
-
Displays ML or Linear depending on the type of loaded model.
- Objective text
-
Displays the Objective selected for the target property. The options include Maximize, Minimize, and Middle Good.
- Aggregator text
-
Displays the Aggregator selected for the target property. Only present for linear models.
- Target text
-
Displays the target property for formulation optimization.
- Ingredient Descriptors text
-
Displays the number of ingredients and descriptors associated with the model. Ensure all loaded ingredients have associated descriptors to use the model. Edit the descriptors using the Select Formulations Models dialog box.
- Weight text box
-
Specify the weight of the target property for the model in relation to other target properties specified.
- Edit icon
-
Click this icon to edit the properties displayed in the ML Models and Properties section.
- Add ML Model button
-
Load ML models generated using the Formulation Machine Learning Panel. Opens the Select Formulations Models dialog box, where you can load and manage formulations ML models. Select the models to use for optimizing the formulation. After model selection, a second dialog box opens allowing editing of the Model Name and specification of the target property using the Properties option menu. Select an Objective for the target property. The options include Maximize, Minimize, and Middle Good. The corresponding Good, Okay, and Bad target property ranges can be set using the text boxes or adjusting the white dashed vertical lines in the plot.
- Add Linear Model button
-
Load an linear model using a CSV file. All of the components in the loaded formulation data must be present in any loaded linear model. Click to open the Select the csv file dialog box, where you can navigate to the file. The name of the file you selected is displayed in the text box and must be unique compared to the other models loaded in this section. After model selection, a second dialog box opens allowing editing of the Model Name and specification of the target property using the Properties option menu. Select an Objective and Aggregator for the target property. The objective options include Maximize, Minimize, and Middle Good. The corresponding Good, Okay, and Bad target property ranges can be set using the text boxes or adjusting the white dashed vertical lines in the plot.
- Delete All Models button
-
Remove all models from the ML Models and Properties section.
- Maximum formulation trials text box or Maximum generations text box
-
Specify the maximum number of formulation trials to run in the optimization. Displays Maximum generations when Genetic algorithm is selected as the Optimization Method.
- Stop Early option and text box
-
Select this option to allow the optimization to stop early. Specify the minimum number of trials to run before the optimization is allowed to stop. The early stopping criterion is met when the average of the top 10 MPO scores exhibit no improvement over 20 consecutive trials.
- Enable early stopping for composition option
-
Select this option to allow the optimization to stop early in the composition search stage of optimization. This can accelerate optimization for systems with complicated composition search spaces. Not available when Brute Force is selected as the Optimization Method.
- Genetic Algorithm Parameters section
-
Specify additional parameters for the genetic algorithm based optimization. Only available when Genetic algorithm is selected as the Optimization Method.
- Population size text box
-
Specify the population, or number of formulations, to maintain at each generation of the genetic optimization.
- Crossover rate text box
-
Specify the crossover rate, which defines the frequency of crossover events. For formulations, crossover is the process of recombining specific ingredients from two high-performing "parent" mixtures to produce a new "offspring" formulation that ideally inherits the best characteristics of both.
- Mutation rate text box
-
Specify the mutation rate, which defines the frequency of mutations. For formulations, mutation is the process of randomly replacing a specific ingredient with an alternative from a predefined library to introduce new chemical variety and prevent the optimization process from getting stuck in a sub-optimal recipe.
- Results tab
-
Analyze the output of the formulation optimization calculation.
- Load Optimization Results button
-
Load the results of a calculation using the Formulations Machine Learning Optimization panel. The output can be found in the job directory with the extension
-.omlform. Click to open the Select optimization results file dialog box, where you can navigate to the file. The name of the file you selected is displayed in the text box. The formulations predicted by this model and their corresponding MPO scores are displayed. - Formulations tab
-
- View ingredients as options
-
Select how to view ingredients in the formulations input table. The options include:
-
SMILES—List each ingredient as a SMILES string. For non-missing or invalid SMILES, the structures will be editable.
-
Labels—List each ingredient with its label. The structures are not editable in this representation of the ingredients.
-
- Formulation table
-
Displays the formulations data output from the optimization calculation. By default, the table is organized with the formulations in descending order of MPO score. Click on the component to view its chemical structure, or in the case of complex formulations, view the chemical composition. The data can be saved as a CSV file using the Export data button.
Data from the formulation table is plotted to the right and can be configured using the Properties option menus. The size of the table and plot can be toggled by dragging the divider between them side to side.
Formulation information—The structures of the formulation and their relative compositions, which should sum up to 100%. For simple formulations, clicking on the SMILES string will open the Component editor. For complex formulations, clicking on the component opens a dialog with information on the formulations' chemical composition.
Additional columns— Iteration number, MPO score, target property predictions, target property uncertainties, target property MPO scores, and any other associated properties. Click on a header to plot a histogram for the data type.
- Properties option menus
-
Choose the x and y axes to display in the plot. The options for the x and y axes are the iteration number, MPO score, target property predictions, target property uncertainties, target property MPO scores, and any other associated properties. To view a histogram of the property specified on the x axis, set the y axis to (none).
- Plot options
-
Select an option to show the value in the displayed scatter plot or modify the plot appearance. Statistics are not available for histograms. The options include:
-
R^2—R-squared value (coefficient of determination)
-
RMSE—Root-mean-square error
-
Pearson’s r—Pearson’s correlation coefficient
-
Same x and y axis—Select this option to enforce the x and y axis to have the same scale and range
-
- Plot toolbar
-
The toolbar has tools for manipulating the plot and for saving images. The buttons that are common to all plot toolbars are described in the Plot Toolbar topic.
- Plot area
-
This area displays the plot of the x vs y axes chosen in the Properties option menus. This can be a histogram or a scatter plot. For scatter plots, a gray dashed line marks the y=x line.
- Export Data button
-
Export data in the formulations table to a CSV file. Opens the Export Formulations Data dialog box so you can navigate to a location and name the file.
- MPO Score tab
-
- Plot toolbar
-
The toolbar has tools for manipulating the plot and for saving images. The buttons that are common to all plot toolbars are described in the Plot Toolbar topic.
- Plot area
-
This area displays the plot of the average of the top 10 MPO scores as a function of the optimization iteration as a solid black line. The The standard deviation of top 10 formulations by MPO scores is shown shaded in gray. The red dashed line shows the average MPO score in the last 20% of the calculation and the shaded red area displays the early stopping criteria set in the Calculations tab.
- Job toolbar
-
Manage job submission and settings. See Job Toolbar for a description of this toolbar.
The Job Settings button opens the Formulation Machine Learning Optimization - Job Settings Dialog Box, where you can make settings for running the job.
- Status bar
-
 to reset the panel to its default settings and clear any data from the panel.
If you can submit a job from the panel, the status bar displays information about the current job settings and status for the panel. The settings include the job name, task name and task settings (if any), number of subjobs (if any) and the host name and job incorporation setting. The job status can include messages about job start, job completion and incorporation.
The status bar also contains the Help button
 , which opens an option menu with choices to open the help topic for the panel (Documentation), launch Maestro Assistant, or if available, choose from an option menu of Tutorials. If the panel is used by one or more tutorials, hover over the Tutorials option to display a list of tutorials. Choosing a tutorial opens the tutorial topic.