Optoelectronics Results Panel
View the results of optoelectronics calculations, as tabular data and as scatter plots.
To open this panel, click the Tasks button and browse to Quantum Mechanics → View Results.
To open this panel from the entry group for the results of an optoelectronics job .
.
The following licenses are required to use this panel: MS Maestro
- Using
- Features
- Additional Resources
Using the Optoelectronics Results Panel
The Optoelectronics Results panel can be used to detect trends and outliers in properties calculated by the Optoelectronics Calculations Panel. The panel contains a table that displays all the data, and a plot that displays user-specified properties. The optoelectronics properties are described in detail in Optoelectronics Properties.
The plot makes it easy to find interesting outliers, such as compounds that have a high triplet energy but a low reduction potential. In addition, the plot allows points to be colored by a third property, which may show (for example) that a cluster of outliers on a plot of triplet energy vs Lmax all tend to have high oxidation potentials.
The spectral data computed using the Optoelectronics Calculations panel can be conveniently plotted from this panel.
This panel also has access to data from the Project Table, and can be used to select and display entries that show the desired relationships on the plot.
Optoelectronics Results Panel Features
- Use structures from option menu
-
Choose the structure source for examination of results.
- Project Table (selected entries)—Use the entries that are currently selected in the Project Table.
- File—Use the specified file. When this option is selected, the File name text box and Browse button are displayed.
- Open Project Table button
-
Open the Project Table panel, so you can

- File name text box and Browse button
-
Enter the file name in this text box, or click Browse and navigate to the file. The name of the file you selected is displayed in the text box.
- Load Data button
-
Load and analyze the results from the selected structure source. Choosing the source does not automatically load the results. This allows you to select different sets of structures and view the results without closing the panel.
You can load any structures into this panel to examine the results, with the exception of intermediate structures in optoelectronics calculations.
- Add/Remove Properties button
-
Add or remove properties of the structures from the table. Opens a property selector, in which you can choose the properties to show in the table. By default, only optoelectronics properties are displayed. This feature allows you to show correlations between optoelectronic properties and other molecular properties.
- Selected rows options
-
Select options for actions to take on the selected rows. The action is applied automatically as you change the row selection. The options are:
- Include in Workspace—Display the entries for the selected rows in the Workspace. All other entries are excluded.
- Select in PT—Change the Project Table selection to only those entries that correspond to the selected rows in the Properties table (deselecting all other entries).
- Show rows buttons
-
Control which rows are shown in the table. By default, all rows are shown. You can restrict the range of rows by selecting them in the table and clicking Selected Only. To redisplay all rows, click All.
- Properties table
-
Display properties for the structures. By default, the entry title, the 2D structure, and the primary properties for optoelectronics calculations are shown. You can select multiple rows, to apply an action. You can also copy and paste data from the table in to another application, using Ctrl+C (⌘C). You can resize the columns or the rows by dragging the borders in the heading row or the row number column.
If the Absorption Spectrum property was selected in the Optoelectronics Calculations panel when computing the current results, the Properties table includes a Spectrum column that contains a button labeled Plot for each row where the absorption window calculation was successful. Clicking this button opens the Spectrum Plot Panel and shows the computed absorption spectrum. If for some reason the spectrum cannot be found, a file dialog opens, requesting the location of the Jaguar spectrum file for this entry.
- X-Axis and Y-Axis option menus
-
Choose the property to be plotted on the given axis. Only numerical properties shown in the table can be selected.
- Color by option menu
-
Color the plot points by a chosen property, using a blue-green-red color ramp, with blue for low values and red for high values. This feature allows you to display the dependence on a third property.
- Plot toolbar
-
The toolbar has tools for manipulating the plot and for saving images. The buttons that are common to all plot toolbars are described in the Plot Toolbar topic.
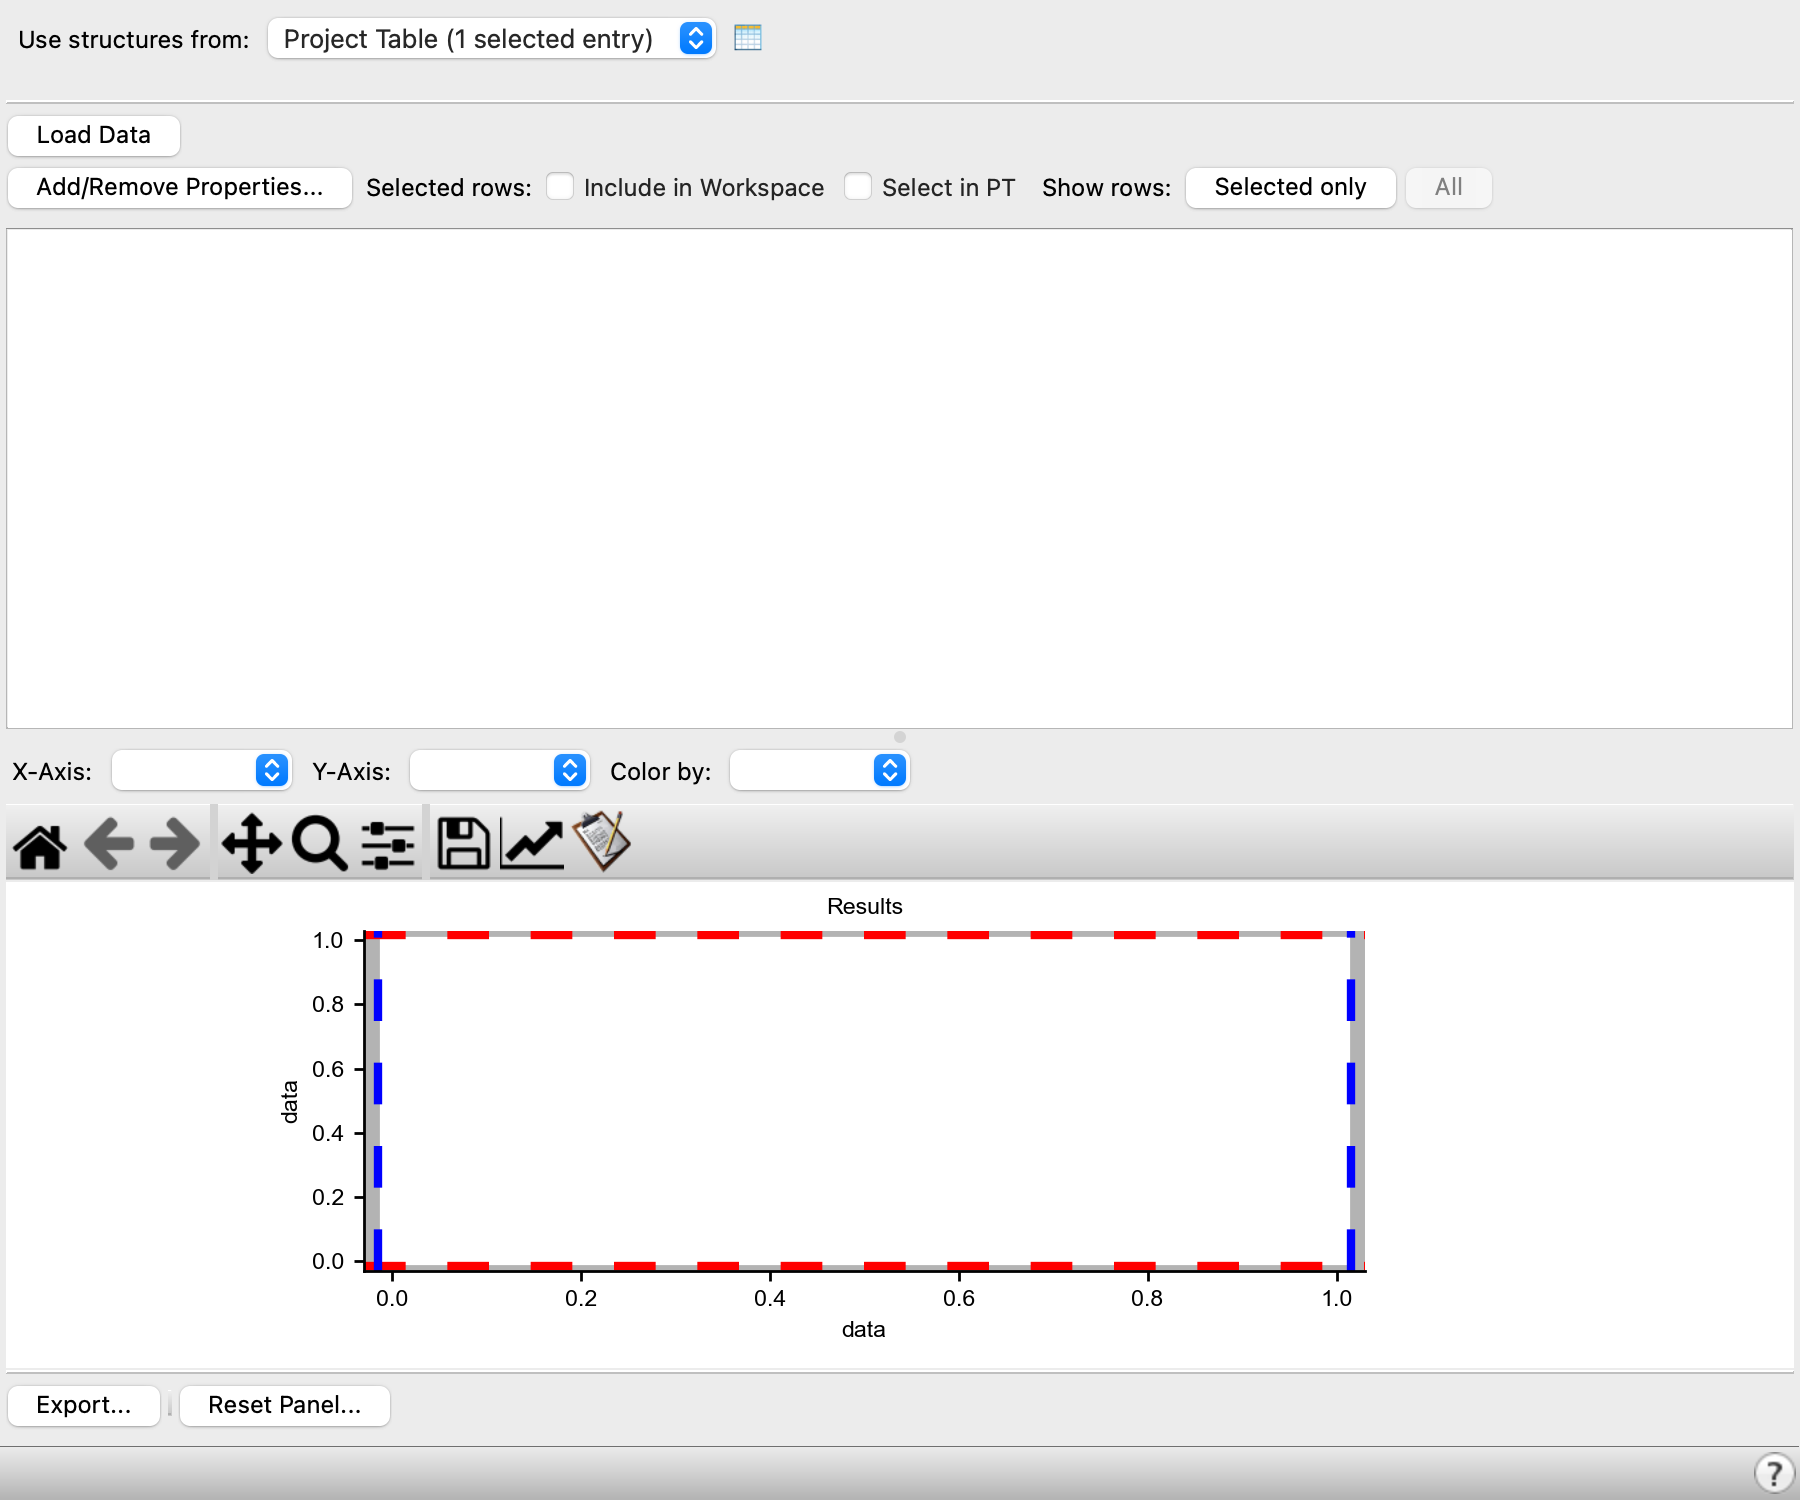
- Plot area
-
Display a scatter plot of the properties chosen for the X and Y axes. Points are plotted for the visible rows in the properties table.
The plot shows horizontal red dotted lines and vertical blue dotted lines. These lines can be dragged in the plot area to create a selection square. The rows in the Properties table corresponding to the points in the white central square are selected. Rows corresponding to the points in grey outer regions of the plot are deselected.
- Export button
-
Export the table contents to a CSV file. Opens a file selector, in which you can navigate to a location and name the file.
- Reset button
-
Clear all data from the panel and reset all settings to the defaults.