Uncertainty Quantification Viewer Panel
Plot within-simulation and between-simulation uncertainties from an uncertainty quantification calculation.
To open this panel: click the Tasks button and browse to Materials → Tools → Uncertainty Quantification Results.
To open this panel from the entry group for the results of an uncertainty quantification job .
.
The following licenses are required to use this panel: MS Maestro
- Features
- Additional Resources
Uncertainty Quantification Viewer Panel Features
Each tab of this panel has a plot area and a plot toolbar. The toolbar features are the same for each plot.
- Import from Workspace button
-
Import the results of an uncertainty quantification run from the entry that is in the Workspace.
- Plot toolbar
-
The toolbar has tools for manipulating the plot and for saving images. The buttons that are common to all plot toolbars are described in the Plot Toolbar topic.
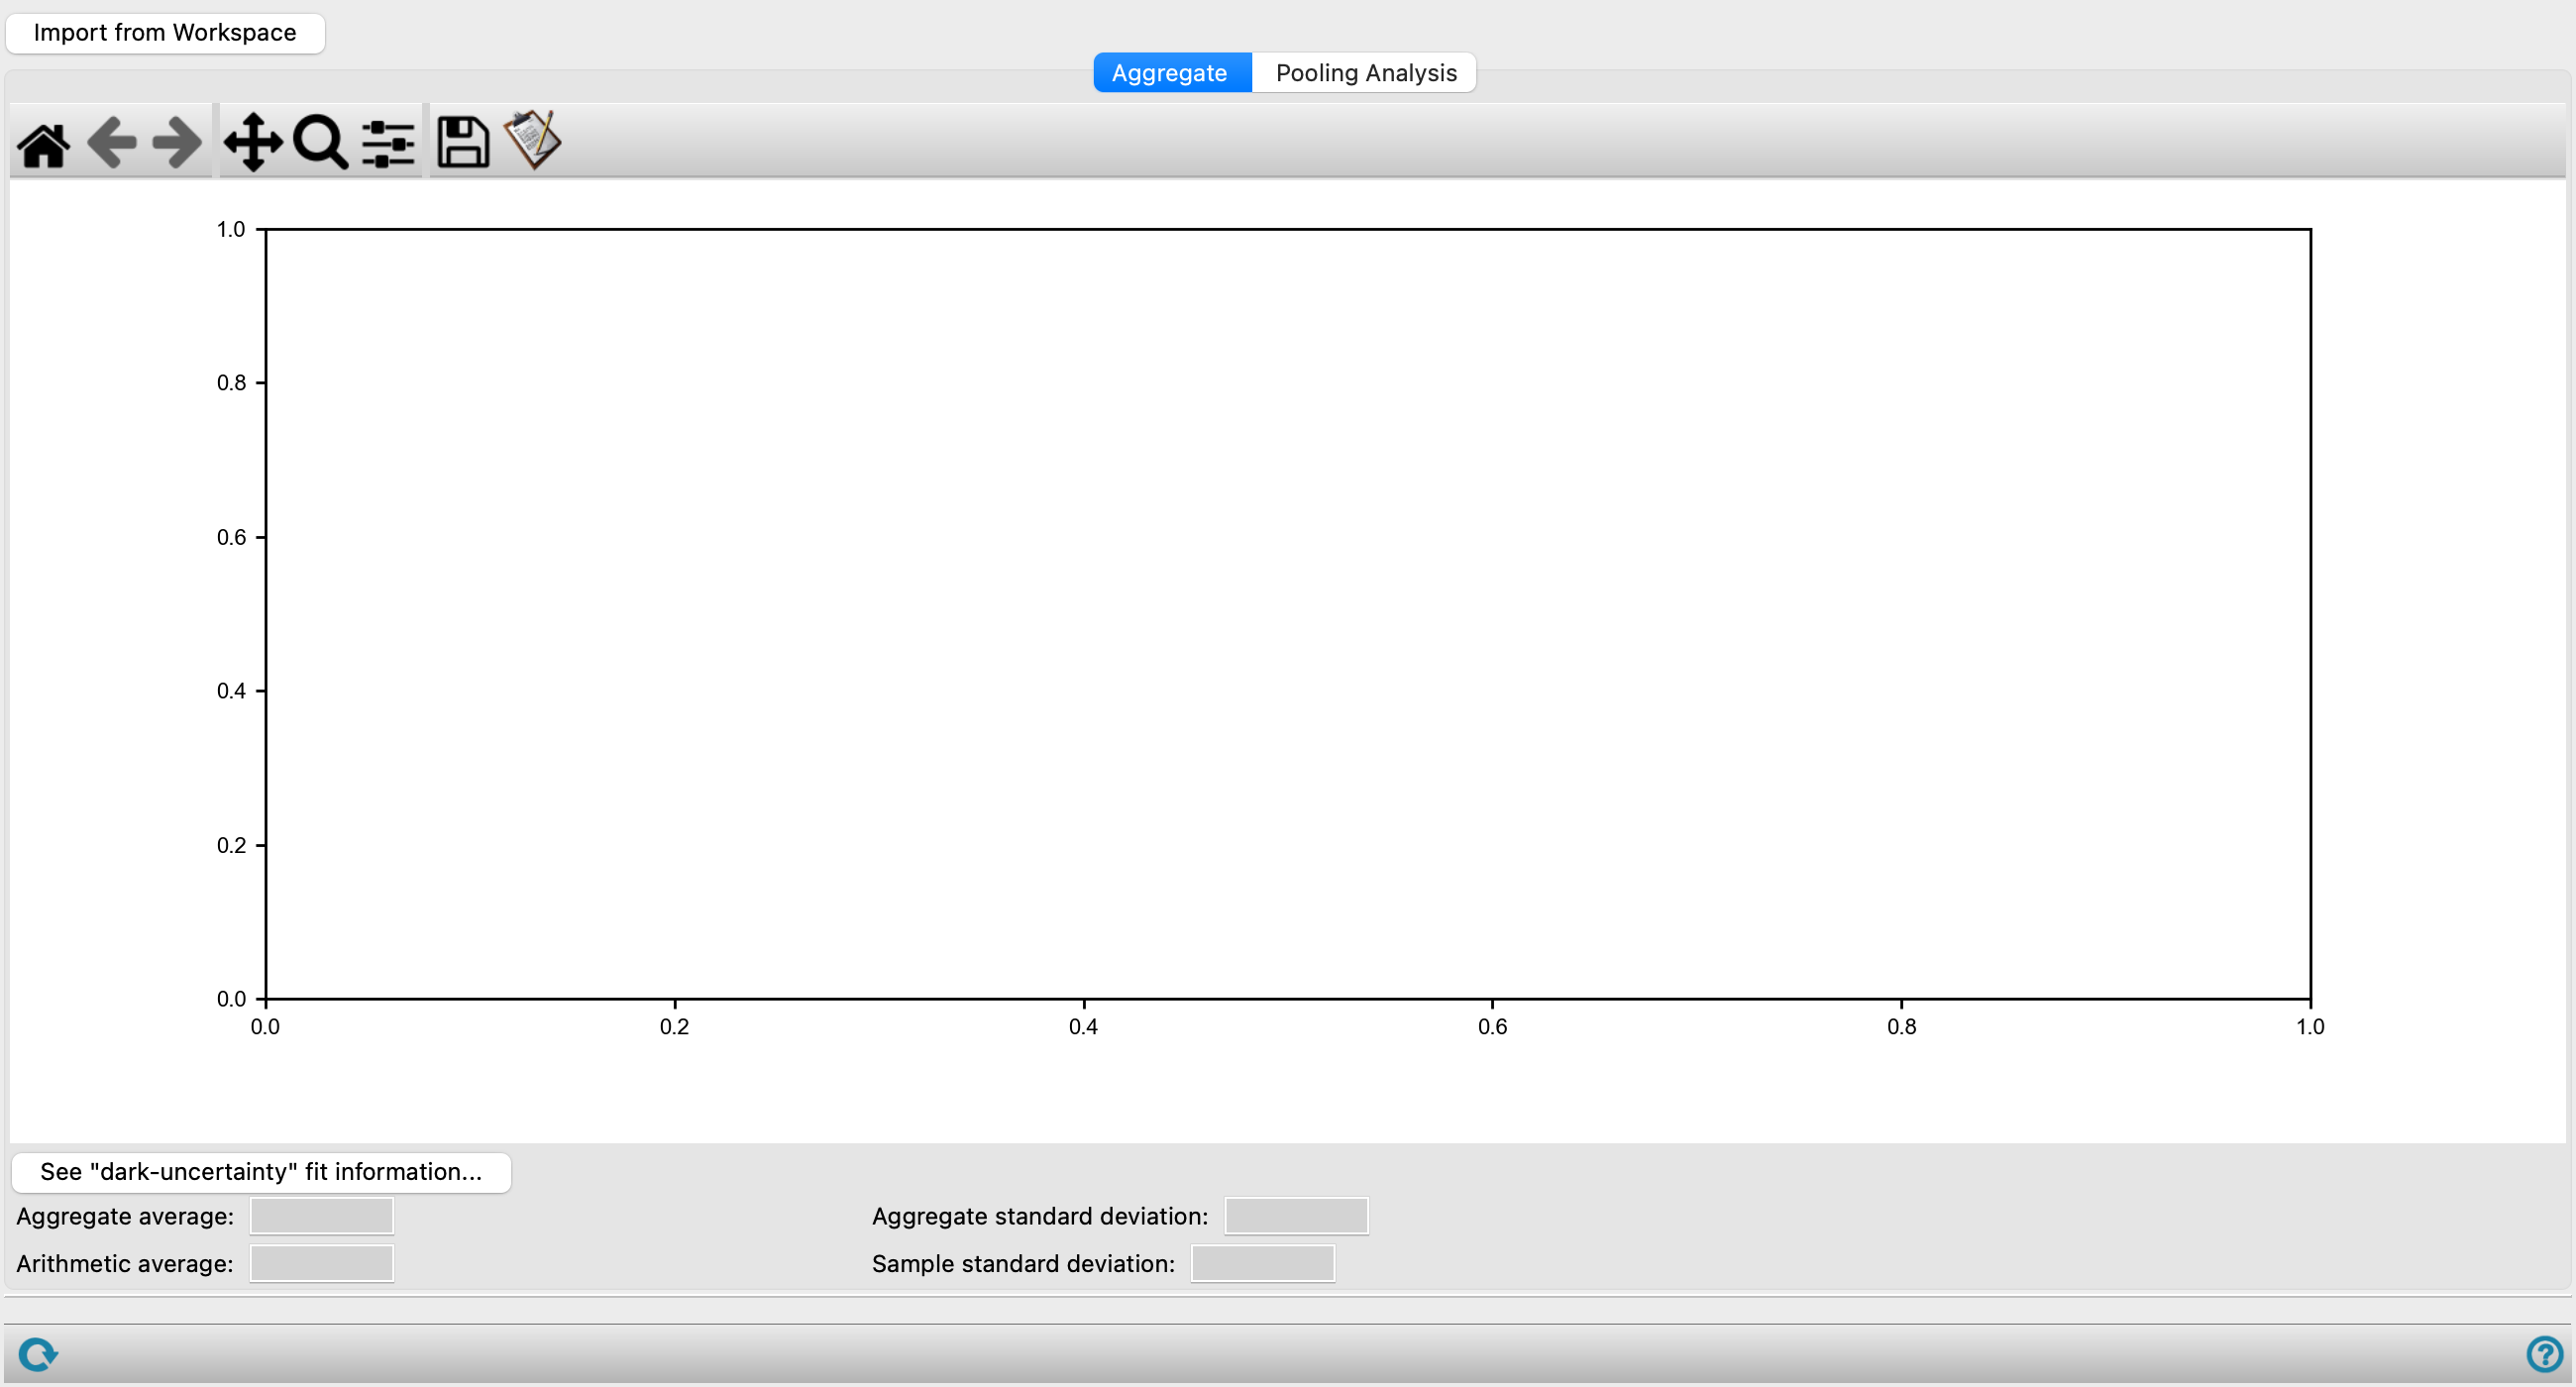
- Aggregate tab
-
Displays plots of Tg with error bars and information about the averages and standard deviations.
- Plot area
-
This area plots Tg with 3σ error bars for each simulation, where σ is the within-simulation uncertainty; and Tg for the aggregate, with 3y error bars, where y is the between-simulation uncertainty, and with 3δ error bars, where δ is the standard deviation for the aggregate. See Patrone et al. [18]
- See dark-uncertainty fit information button
-
Display information on the "dark uncertainty" y and its calculation in an information box.
- Property value boxes
-
These text boxes show the values of various statistics from the plot.
-
Aggregate average—Tg from weighted average of all data (see eq. 26 of Patrone et al. [18]).
-
Aggregate standard deviation—standard deviation δ from aggregation of all data.
-
Arithmetic average—average of the Tg values that were derived from each simulation.
-
Sample standard deviation—standard deviation of the Tg values that were derived from each simulation.
-
- Pooling Analysis tab
-
Displays plots based on pooling information to check the dependence of the results on the system size (section 4 of Patrone et al. [18]
- Status bar
-
 to reset the panel to its default settings and clear any data from the panel.
If you can submit a job from the panel, the status bar displays information about the current job settings and status for the panel. The settings include the job name, task name and task settings (if any), number of subjobs (if any) and the host name and job incorporation setting. The job status can include messages about job start, job completion and incorporation.
The status bar also contains the Help button
 , which opens an option menu with choices to open the help topic for the panel (Documentation), launch Maestro Assistant, or if available, choose from an option menu of Tutorials. If the panel is used by one or more tutorials, hover over the Tutorials option to display a list of tutorials. Choosing a tutorial opens the tutorial topic.