Uncertainty Quantification Panel
Calculate the within-simulation uncertainty for multiple thermophysical property or stress-strain simulations, both from individual simulations and from pooled data sets.
To open this panel: click the Tasks button and browse to Materials → Tools → Uncertainty Quantification Calculations.
The following licenses are required to use this panel: MS Maestro
- Using
- Features
- Additional Resources
Using the Uncertainty Quantification Panel
This panel is used to set up a job for the uncertainty quantification of the prediction of the glass transition temperature or the yield strain from multiple thermophysical property simulations. The within-simulation uncertainty quantification is done in the same way as in the Thermophysical Properties Analysis Panel. The methods used are described in the paper by Patrone et al. [18]. The between-simulation uncertainty is calculated in the Uncertainty Quantification Viewer Panel. The latter panel reads the output of an uncertainty quantification job run from this panel, so the selection of the input thermophysical property or stress-strain simulations in this panel should be consistent with the goal of calculating between-simulation uncertainties. In addition, the pooling analysis in section 4 of Patrone et al. [18]
To write out the input file and a script for running the job from the command line, click the arrow next to the Settings button  and choose Write.
To visualize the results of the calculation, you can use the Uncertainty Quantification Viewer Panel (click the Tasks button and browse to Materials → Tools → Uncertainty Quantification Results). To open this panel from the entry group for the results of a job .
.
Uncertainty Quantification Panel Features
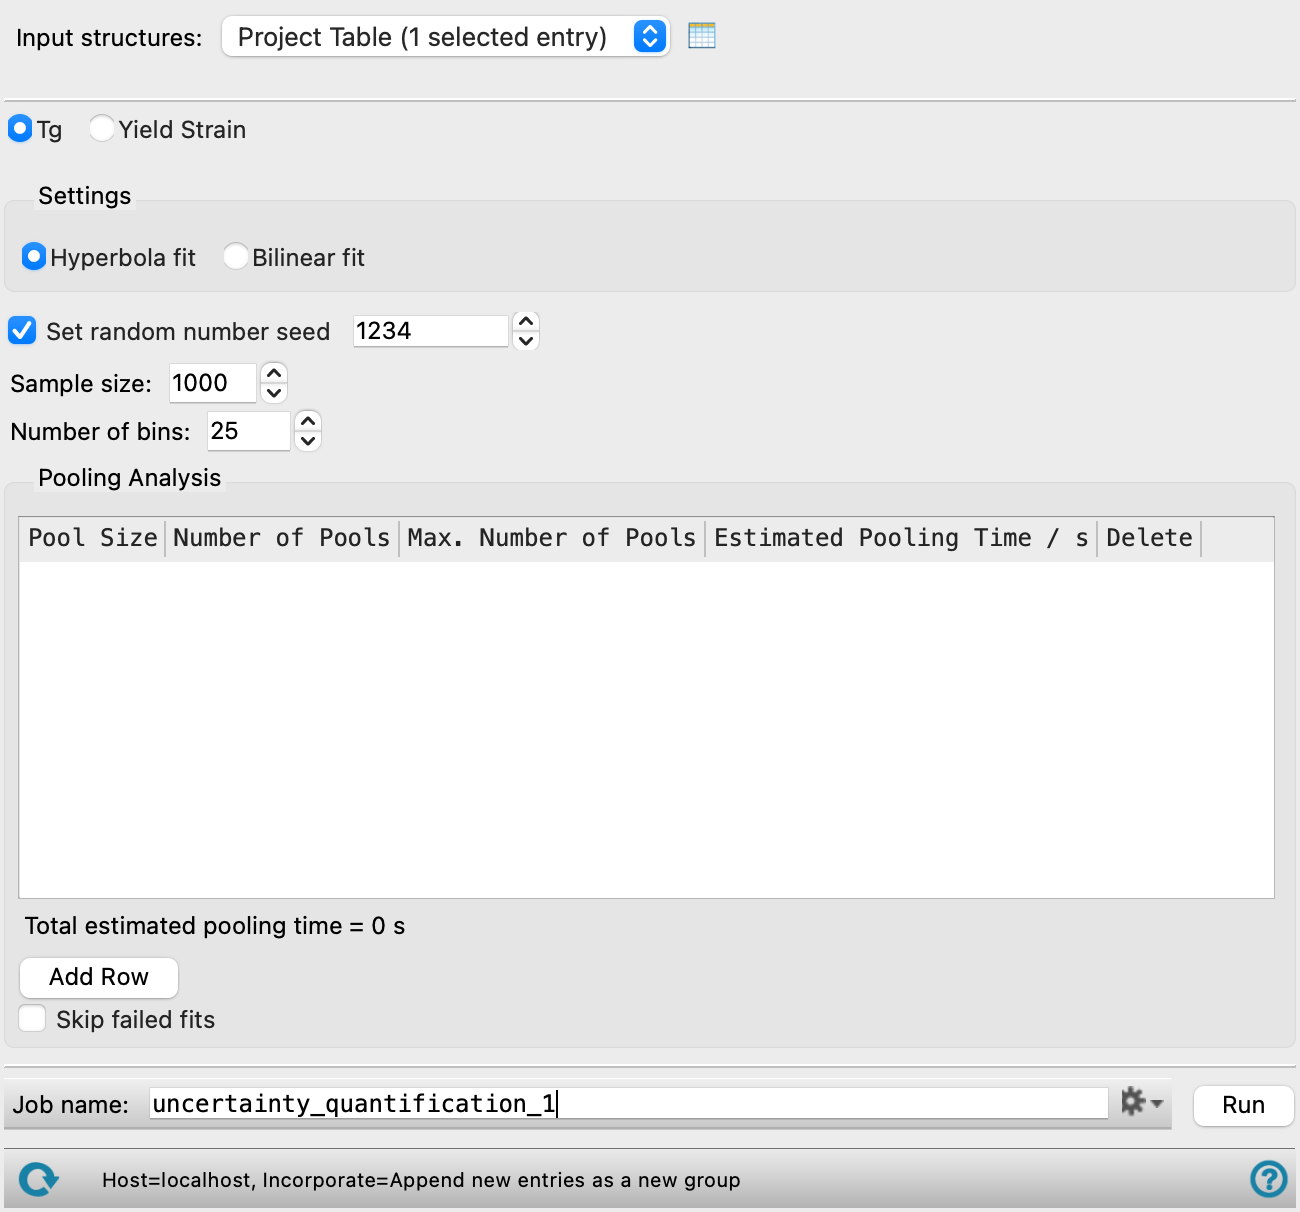
- Input structures option menu
-
Choose the structure source for the uncertainty quantification. The input structures should have the same connectivity, but not necessarily the same geometry.
- Project Table (n selected entries)—Use the entries that are currently selected in the Project Table or Entry List. The number of entries selected is shown on the menu item.
- Workspace (included entry)—Use the entry that is currently included in the Workspace. Only one entry must be included in the Workspace.
- File—Use the specified file. When this option is selected, the File name text box and Browse button are displayed.
- Project Table (n selected entries)—Use the entries that are currently selected in the Project Table or Entry List. The number of entries selected is shown on the menu item.
- Open Project Table button
-
Open the Project Table panel, so you can

- File name text box and Browse button
-
Enter the file name in this text box, or click Browse and navigate to the file. The name of the file you selected is displayed in the text box.
- Property options
-
Choose the property for which you want to quantify the uncertainty, from Tg, for thermophysical property simulations, or Yield strain, for stress-strain simulations. The choice determines the features that are shown in the Settings section.
- Settings section
-
The settings in this section depend on the choice of the property.
- Tg fit options
-
Choose the type of fit used to determine Tg for the uncertainty quantification.
-
Hyperbola fit—Fit all points to a hyperbola. The glass transition temperature is taken as the temperature at which the two asymptotes intersect.
-
Bilinear fit—Perform separate linear regressions on the low temperature (glassy) region and the high temperature (rubbery) region. The glass transition temperature is taken as the temperature at which the two lines intersect.
These settings are discussed in more detail in Using the Thermophysical Properties Analysis Panel.
-
- Applied strain axis option menu
-
Select the crystal axis along which the strain was applied in the stress-strain simulations. Average means use the average effective stress and strain over the three axes. If you choose this option, the Applied strain component is set to effective and cannot be changed. The effective strain is calculated for each of the three axes, then averaged. The definition of the effective strain can be found here.
- Applied strain component option menu
-
Choose the component of the strain to use as the independent variable in the fitting of the residual strain to determine the yield strain: from normal or transverse for the normal yield strain, or effective for the effective yield strain.
- Set random number seed option and text box
-
Select this option to specify a random seed for generating the Gaussian noise in the uncertainty calculations. Specifying the seed allows you to reproduce the results, unless other factors affect them. If this option is not selected, a seed is chosen at random.
- Sample size text box
-
Number of synthetic data sets to be used in estimating the uncertainty.
- Number of bins text box
-
Number of bins for the partitioning of the Tg predictions from the synthetic data. These are used to construct a histogram for display of the uncertainty data.
- Pooling Analysis section
-
Set up pooling of simulation data for uncertainty quantification (section 4 of Patrone et al. [18]. Each pool consists of a specified number of simulation data sets, selected at random. The data from all the sets is combined (pooled) and then the uncertainty quantification is performed on this pooled data set. The time taken for the uncertainty quantification is proportional to the total number of pools. Creating all possible pools results in a combinatorial explosion of the time taken, so this section provides tools for judicious selection pool sizes and number of pools of each size. Pool sizes of 1 and N (the number of simulations) are excluded, as the uncertainties are calculated for these sizes automatically.
- Pooling table
-
Specify sets of pools of simulation data of a given size used for uncertainty quantification. Each set of pools is specified on a row of the table. The columns of the table are described below.
Pool Size Specify the number of simulation data sets in each pool. Number of Pools Specify the number of pools of the specified size. If this is less than the maximum, the pools are chosen at random. Max. Number of Pools The maximum number of pools for the given pool size is reported in this column. Estimated Pooling Time /s The estimated time for calculating the uncertainties from the pooled data, in seconds, is reported in this column. Delete Delete the current row. - Add Row button
-
Add a row to the pooling table for definition of a new set of pools.
- Skip failed fits option
-
Skip fitting failures in the pooling analysis, and report only results from successful fits. The job fails if all fits fail. If this option is not selected, the job fails at the first fit failure.
- Job toolbar
-
Manage job submission and settings. See Job Toolbar for a description of this toolbar.
The Job Settings button opens the Uncertainty Quantification - Job Settings Dialog Box, where you can make settings for running the job.
- Status bar
-
The status bar displays information about the current job settings and status for the panel. The settings includes the job name, task name and task settings (if any), number of subjobs (if any) and the host name and job incorporation setting. The job status can include messages about job start, job completion and incorporation.
Use the Reset button
 to reset the panel to its default settings and clear any data from the panel.
 The status bar also contains the Help button
 , which opens the help topic for the panel in your browser. If the panel is used by one or more tutorials, hovering over the Help button displays a
  button, which you can click to display a list of tutorials (or you can right-click the Help button instead). Choosing a tutorial opens the tutorial topic.