QM-Based Machine Learning Models
Summary
The Schrödinger Materials Science team has generated several machine learning (ML) models for optoelectronics properties (available in the Optoelectronics Calculations Panel) which are trained on data obtained from quantum mechanics (QM) calculations. These calculations were performed on custom-built molecule libraries tailored to electronics applications. In certain cases, experimental data is used to finetune the QM-trained models to enhance the accuracy of the ML predictions. ML models are trained with Schrödinger's automated ML workflow, DeepAutoQSAR.
Each quantum-mechanics based machine learning (QM-ML) model is available in the Machine Learning Property Prediction Panel. These models are summarized in Table 1. Parity plots illustrating model performance are provided in Figures 1-4 at the end of the page. For interested users, further details are provided below in order to fully contextualize the properties and materials being modeled, as well as the means by which training set data was generated.
Table 1. Properties supported by QM-ML models. We include the chemical space of the model and the corresponding modeled environment. Also provided is information about training data used during construction.
| Property | Materials | Environment | Training Methods | ||||
Oxidation Potential vs. SCE
( ) ) |
Electrolyte | Acetonitrile, at 298 K | QM pre-trained, Experimental fine-tuning | ||||
Reduction Potential vs. SCE
( ) ) |
Electrolyte | Acetonitrile, at 298 K | QM pre-trained, Experimental fine-tuning | ||||
Scaled HOMO
( ) ) |
OLED | Toluene, at 298 K | QM | ||||
Scaled LUMO
( ) ) |
OLED | Toluene, at 298 K | QM | ||||
Hole Reorganization Energy
( ) ) |
OLED | Toluene, at 298 K | QM | ||||
Electron Reorganization Energy ( ) ) |
OLED | Toluene, at 298 K | QM | ||||
Triplet Energy
( ) ) |
OLED | Toluene, at 298 K | QM | ||||
Triplet Reorganization Energy
( ) ) |
OLED | Toluene, at 298 K | QM | ||||
| Vertical S1T1 Gaps | OLED | Toluene, at 298 K | QM |
Molecular Library Generation
The models described above were trained using one of two libraries generated internally for electrolyte molecules and OLED molecules. Each library consists of (1) species described in literature and industrial sources, and (2) a set of enumerated molecules constructed from central core moieties as well as ligands and functional groups.
Electrolytes
All of the molecules in this library are organic, neutral, closed-shell molecules.
The enumerated library was constructed using the Custom R-Group Enumeration Panel. A total of 64 core molecules and 25 functional groups relevant to electronics applications were used in the enumeration. The enumeration was done such that we get cores, as well as all their mono-, and di-substituted derivatives. All unique diastereomers are maintained to build the final set.
A set of ~600 molecules were obtained from literature since they have experimental values for redox potentials in acetonitrile vs. SCE [1, 2, 3]. The experimental potentials were used to fine-tune the initial pre-trained ML model of QM calculated values.
OLEDs
This library contains both organic compounds and organometallic complexes. The organometallics are all mononuclear Al-, Ir-, or Pt-based complexes. All of the molecules in this library are neutral, closed-shell molecules.
The organic and organometallic components of this library varied in their enumeration method.
Organic molecules were enumerated considering different motifs: (1) D-A, (2) D-A-D, (3) D-L-A. Here D and A, indicate the molecule group as a likely donor and acceptor, respectively. The L indicates a linker group, which in the case of this library is a benzene fragment. This label was assigned using Optoelectronics screening mode calculations. We also included more general core-ligand enumerations with smaller fragments. This enumeration was done using an in-house Python script based on code from the Custom R-Group Enumeration Panel. All unique diastereomers are maintained. In total we utilized several thousand cores and ligands to combine, so the final set was a random sampling of the full, enumerated set.
For organometallics, we identified 102 ligands of interest. For enumeration, it is assumed that the Ir and Al complexes would all be octahedral. Whereas, Pt had a mixture of tetrahedral and square planar subsequently cleaned. This was done using the Complex Enumeration and Stability Analysis Panel.
Lastly, the set was supplemented with organic and organometallic compounds that have been investigated in regard to their efficacy as OLED device materials. These literature compounds were compiled from 20+ academic reviews, 500+ primary academic sources, as well as some industrial reports.
QM Data Generation
Procedures for calculating each property are similar to their corresponding workflows in the Optoelectronics Calculations Panel, which are outlined on the Optoelectronics Properties page. Some parameters have been modified to enhance the accuracy of the calculations. Successfully calculated property values are accepted into the training set unless certain issues are observed: (1) changes in bond-connectivity during optimization; (2) the value is an outlier compared to other values, or (3) the value is unphysical (e.g., reorganization energies below zero).
While the methodology used for the majority of the models is similar, the parameters of the calculations will differ based upon the property of interest. Principally, there are notable differences for calculations strictly involving ground-state properties for the lowest lying singlet (S0) and/or triplet (T1) states, versus properties involving excited electronic states, e.g., S1, S2, or S3.
All ground-state properties were determined at the B3LYP-D4/[ma-]def2-TZVPP//GFN2-xTB level of theory; Here, [ma-] denotes the use of ma-def2-TZVPP for property calculations involving anions (see Eqns 3, 5, 7). Tight convergence parameters and geometry checks (via `check_min=1`) are used to achieve more reliable predictions.
Several properties (Eqns 2-5, 8) involve the calculation of the Gibbs free energy, determined using:

|
(1) |
Only the reorganization energies (Eqns 6 and 7) simply use  . For these calculations, we assume standard conditions. The
  will vary based on the property.
Optimization and frequency calculations were done at the GFN2-xTB level-of-theory in gas-phase. From this, the zero-point vibrational energy ( ), thermal correction, (
 ), and entropy (
 ) terms are calculated assuming the rigid-rotor harmonic oscillator approximation. Using these geometries, the solution-phase electronic energy (
 ) was determined via a single-point B3LYP-D4/[ma-]def2-TZVPP calculation with the conductor-like continuum polarizable model (C-PCM); the dielectric constant and index of refraction was set to the corresponding solvent.
Lastly, for all processes described below that lead to charged species, these involve single-electron oxidations and reductions. Hence, the (charge, multiplicity) pair for the neutral, cation, and anion states are (0, 1), (1, 2), and (-1, 2), respectively.
Calculations of the vertical S1T1 gaps involve the first excited singlet state. Therefore, these calculations utilize time-dependent density functional theory (TD-DFT) within the Tamm-Dancoff approximation. The TD-DFT calculations were done at the B3LYP-D4/def2-TZVPP level of theory using C-PCM parameters discussed above. For these calculations, we use the T1 geometry optimized at the GFN2-xTB level of theory.
Redox Potentials

|
(2) |

|
(3) |
The ML-predicted redox potentials of a material ( ) correspond to the change in the adiabatic Gibbs free energy (
 ) for a single-electron oxidation or reduction. See Eqn 1 for the
  calculation. The denominator includes the number of electrons transferred (
 ), which in this case is 1, as well as Faraday’s constant (
 ).
).
Each process is assumed to occur in acetonitrile (CH3CN) solution. Potentials are reported relative to the saturated calomel electrode (SCE) by shifting the reference using the final two terms Eqns 2,3: first to the SHE ( ) and then to SCE (
 ) [4]. The latter value corresponds to measurements in acetonitrile. As per IUPAC, we calculate the oxidation potential as reduction of the oxidized species (
 ). The reduction potential (
 ) is calculated as normal.
Scaled HOMO and Scaled LUMO

|
(4) |

|
(5) |
The ML-predicted HOMO and LUMO energy levels of a material ( ) are predicted similarly to the oxidation and redox potentials, respectively, which are discussed above. See Eqn 1 for the
  calculation. The denominator includes the number of electrons transferred (
 ), which in this case is 1, as well as Faraday’s constant (
 ).
).
The principal difference in the calculation is that in this case, the environment modeled by the C-PCM is assumed to be a low-dielectric medium similar to toluene ( ).
).
Hole and Electron Reorganization Energy

|
(6) |

|
(7) |
The ML-predicted hole and electron reorganization energy are the sum of reorganization energies of two molecules of the same kind, one neutral ( ) and one charged (
 ), following electron transfer. This process can be written as:
  , where for hole and electron reorganization we yield
  and
and  , respectively. The energy terms on the right-hand side (
 ) denote whether the molecule is on the neutral or charged potential energy surface for in the calculations for the calculations. The subscript denotes the state corresponding to the xTB optimization to get the relaxed geometry and the superscript denotes the state corresponding to the B3LYP-D4 PCM calculation. Lastly, we highlight that this internal reorganization only, the energetic effects from relaxation of the environment are not included.
Triplet Energy

|
(8) |
The ML-predicted energies are simply the change in the Gibbs Free energy ( ) for the S0→T1 where PCM calculations were done in a low-dielectric medium similar to toluene (
 ). See Eqn 1 for the
  calculation.
Triplet Reorganization Energy

|
(9) |
The ML-predicted triplet reorganization energy is the sum of reorganization energies of two molecules of the same kind, one in the ground singlet state ( ) and one in the ground triplet state (
 ). This process can be written as:
  . The energy terms on the right-hand side (
 ) denote the electronic state for in the calculations. The subscript denotes the state corresponding to the xTB optimization to get the relaxed geometry and the superscript denotes the state corresponding to the B3LYP-D4 PCM calculation. Lastly, we highlight that for this internal reorganization only, the energetic effects from relaxation of the environment are not included.
S1T1 Vertical Gaps
The ML-predicted S1T1 gaps correspond to energy for a vertical transition from the lowest energy triplet state (T1) to the first excited singlet state (S1).
As stated above, these values utilize TD-DFT to calculate the vertical transition. No optimization of the singlet state was conducted. For a set of OLED materials, we found that there was a significant correlation (Pearson R = 0.82) between the computed vertical gaps to adiabatic gaps from experiment. Users may scale the ML-predicted values to approximate the adiabatic transitions using the linear correction:  .
.
Performance of Models
Parity plots given below illustrate the performance of each ML model. For each property, we assess the model’s ability to reproduce the calculated QM values used for training. For the redox potentials, we also assess performance against experiment.
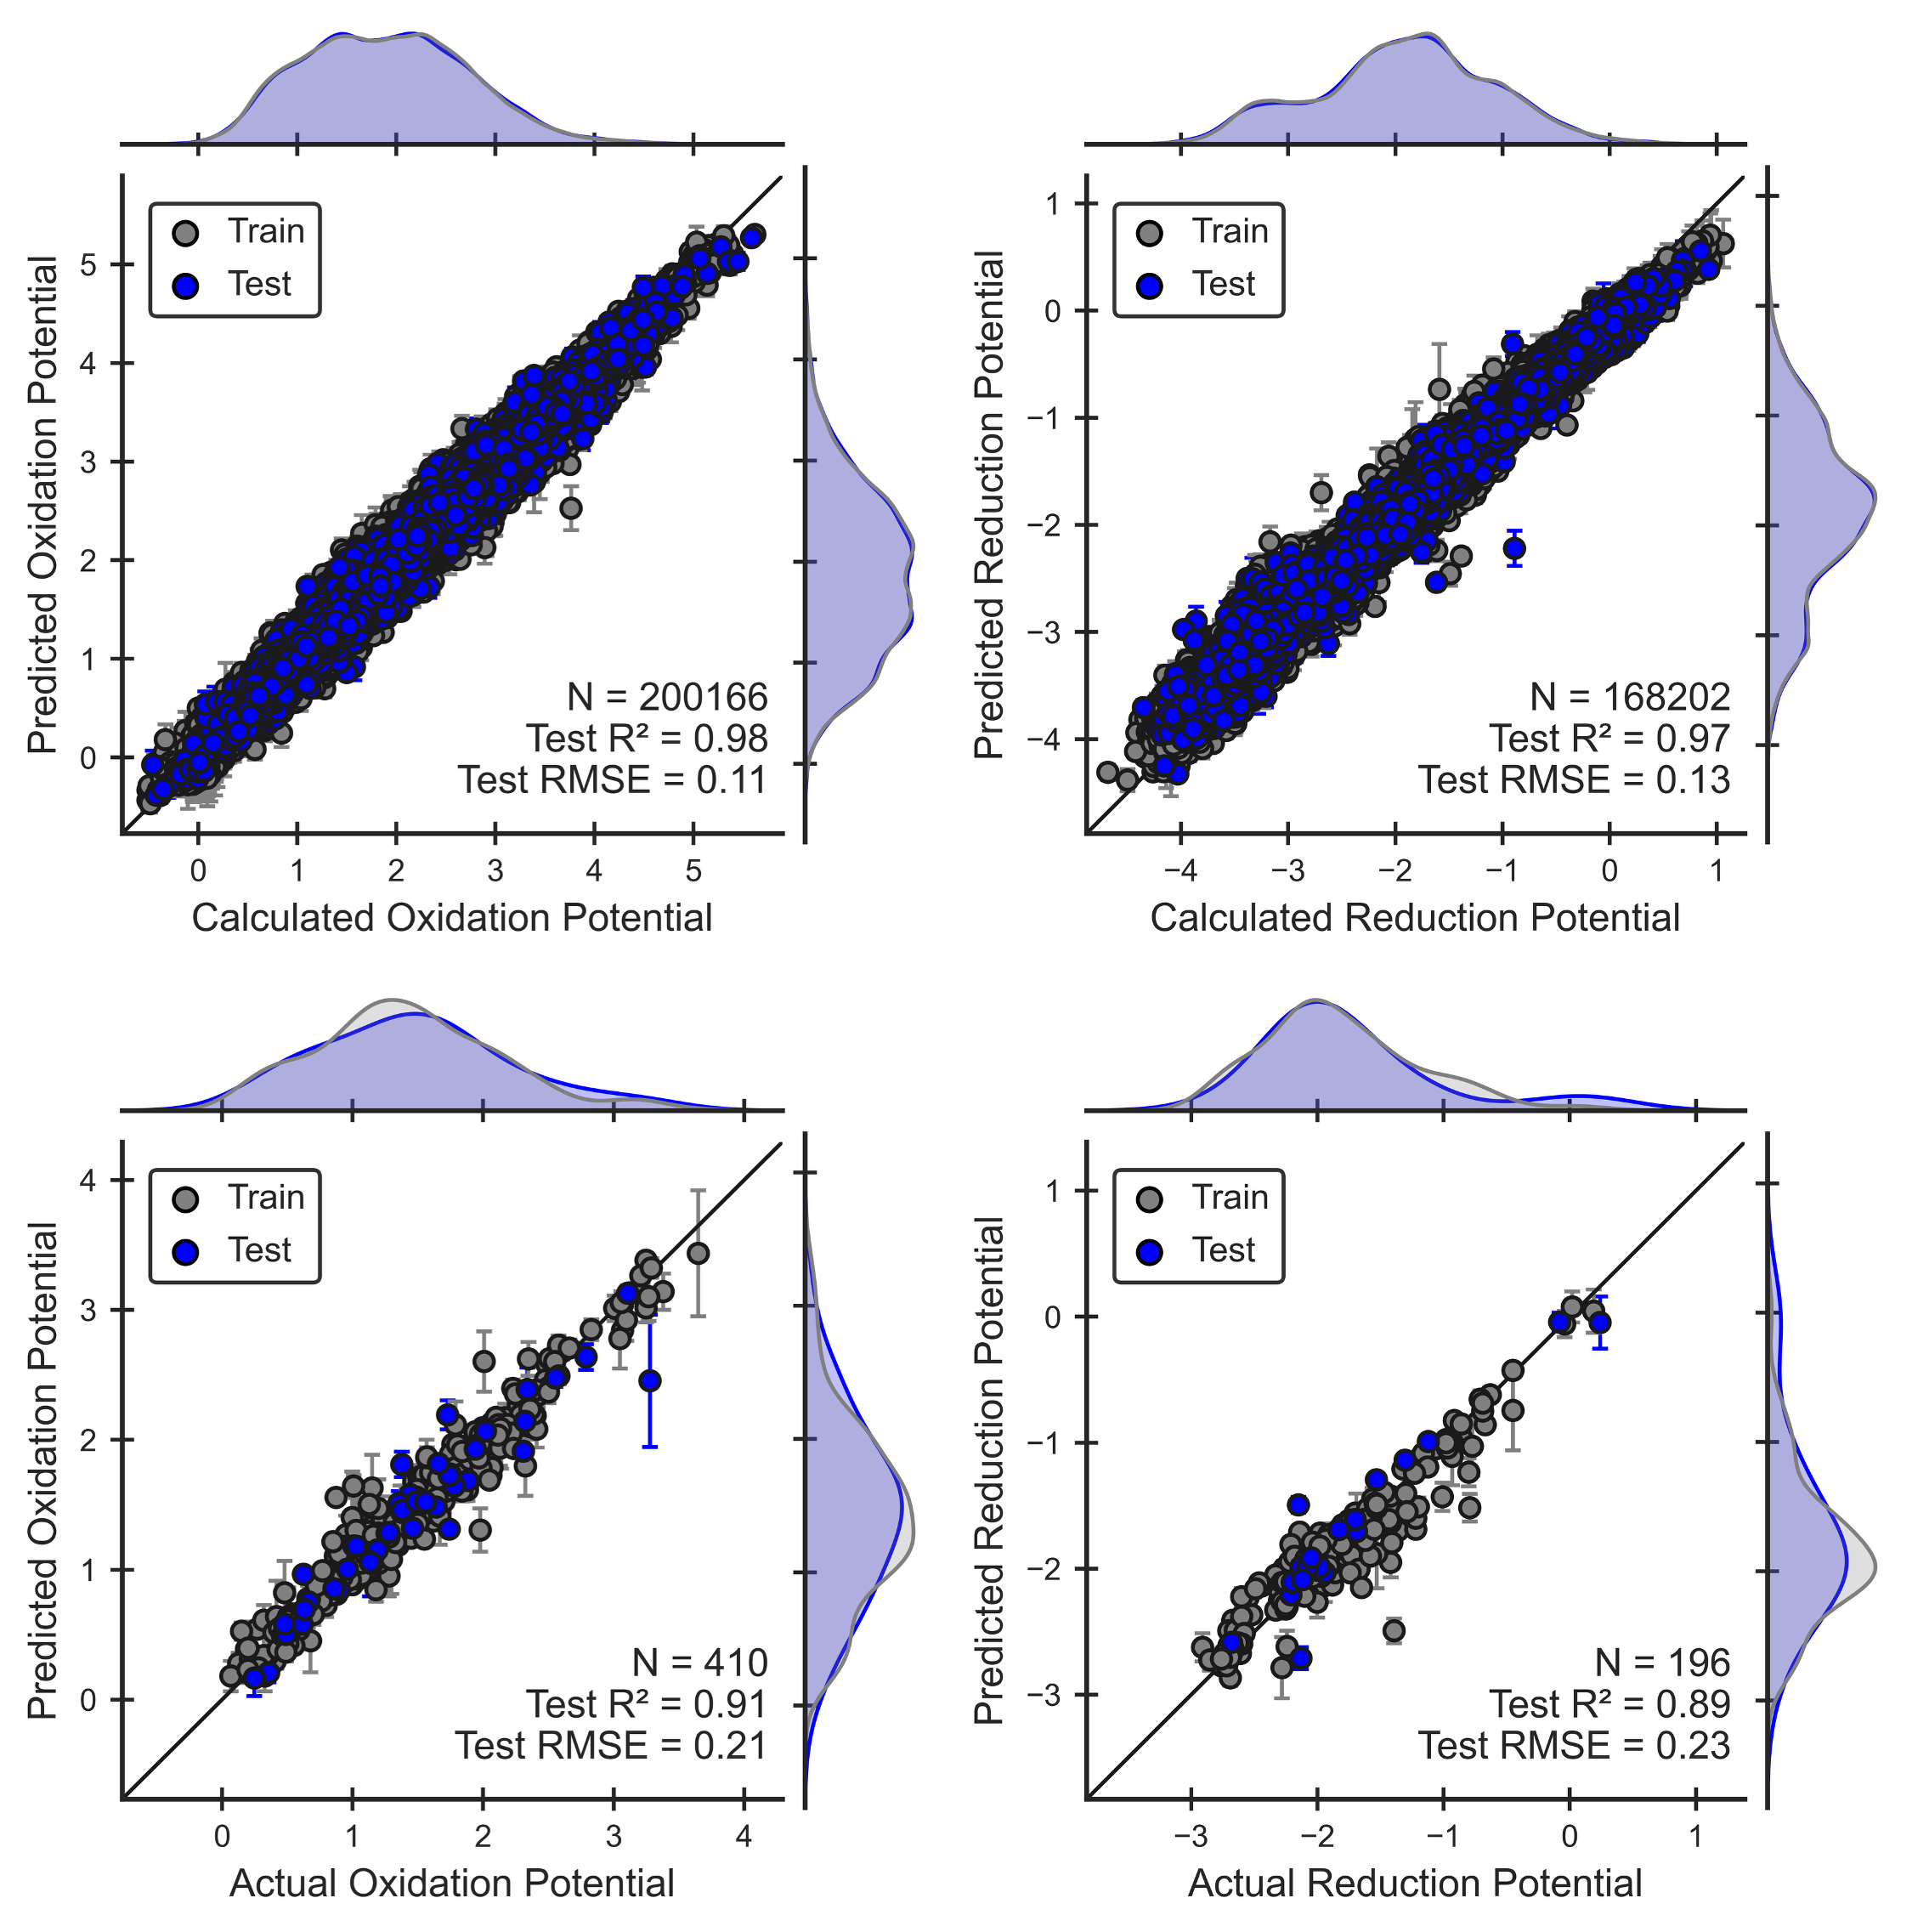
Figure 1. Performance of the oxidation and reduction ML models for electrolyte molecules. Parity plots show that these models can reproduce QM calculations (Eqns 2,3) and experimental values [1, 2, 3] .
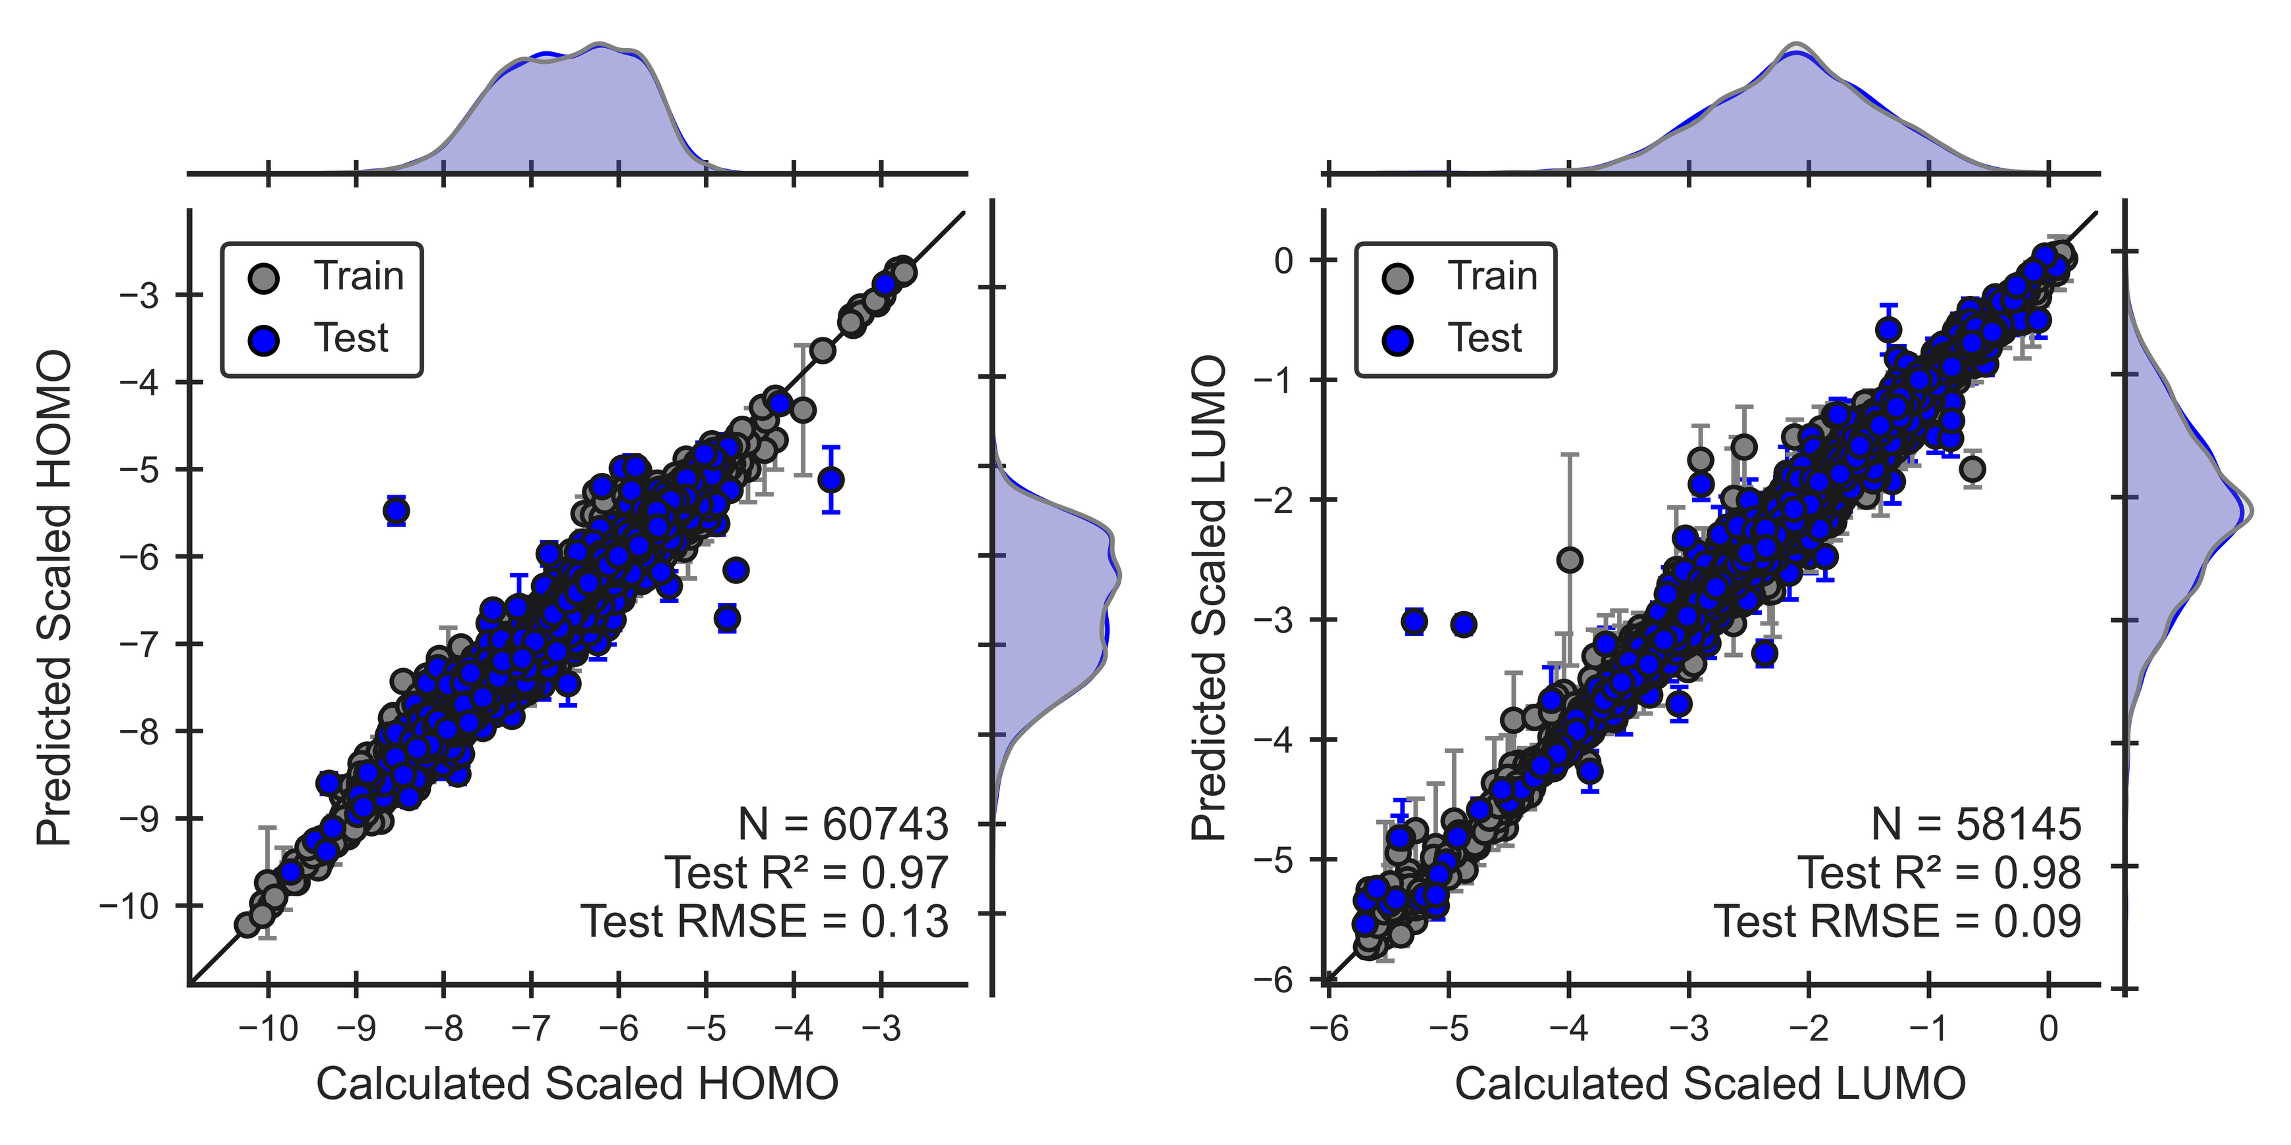
Figure 2. Performance of the scaled HOMO and LUMO ML models for OLED molecules. Parity plots show that models can reproduce QM calculations (Eqns 4,5).
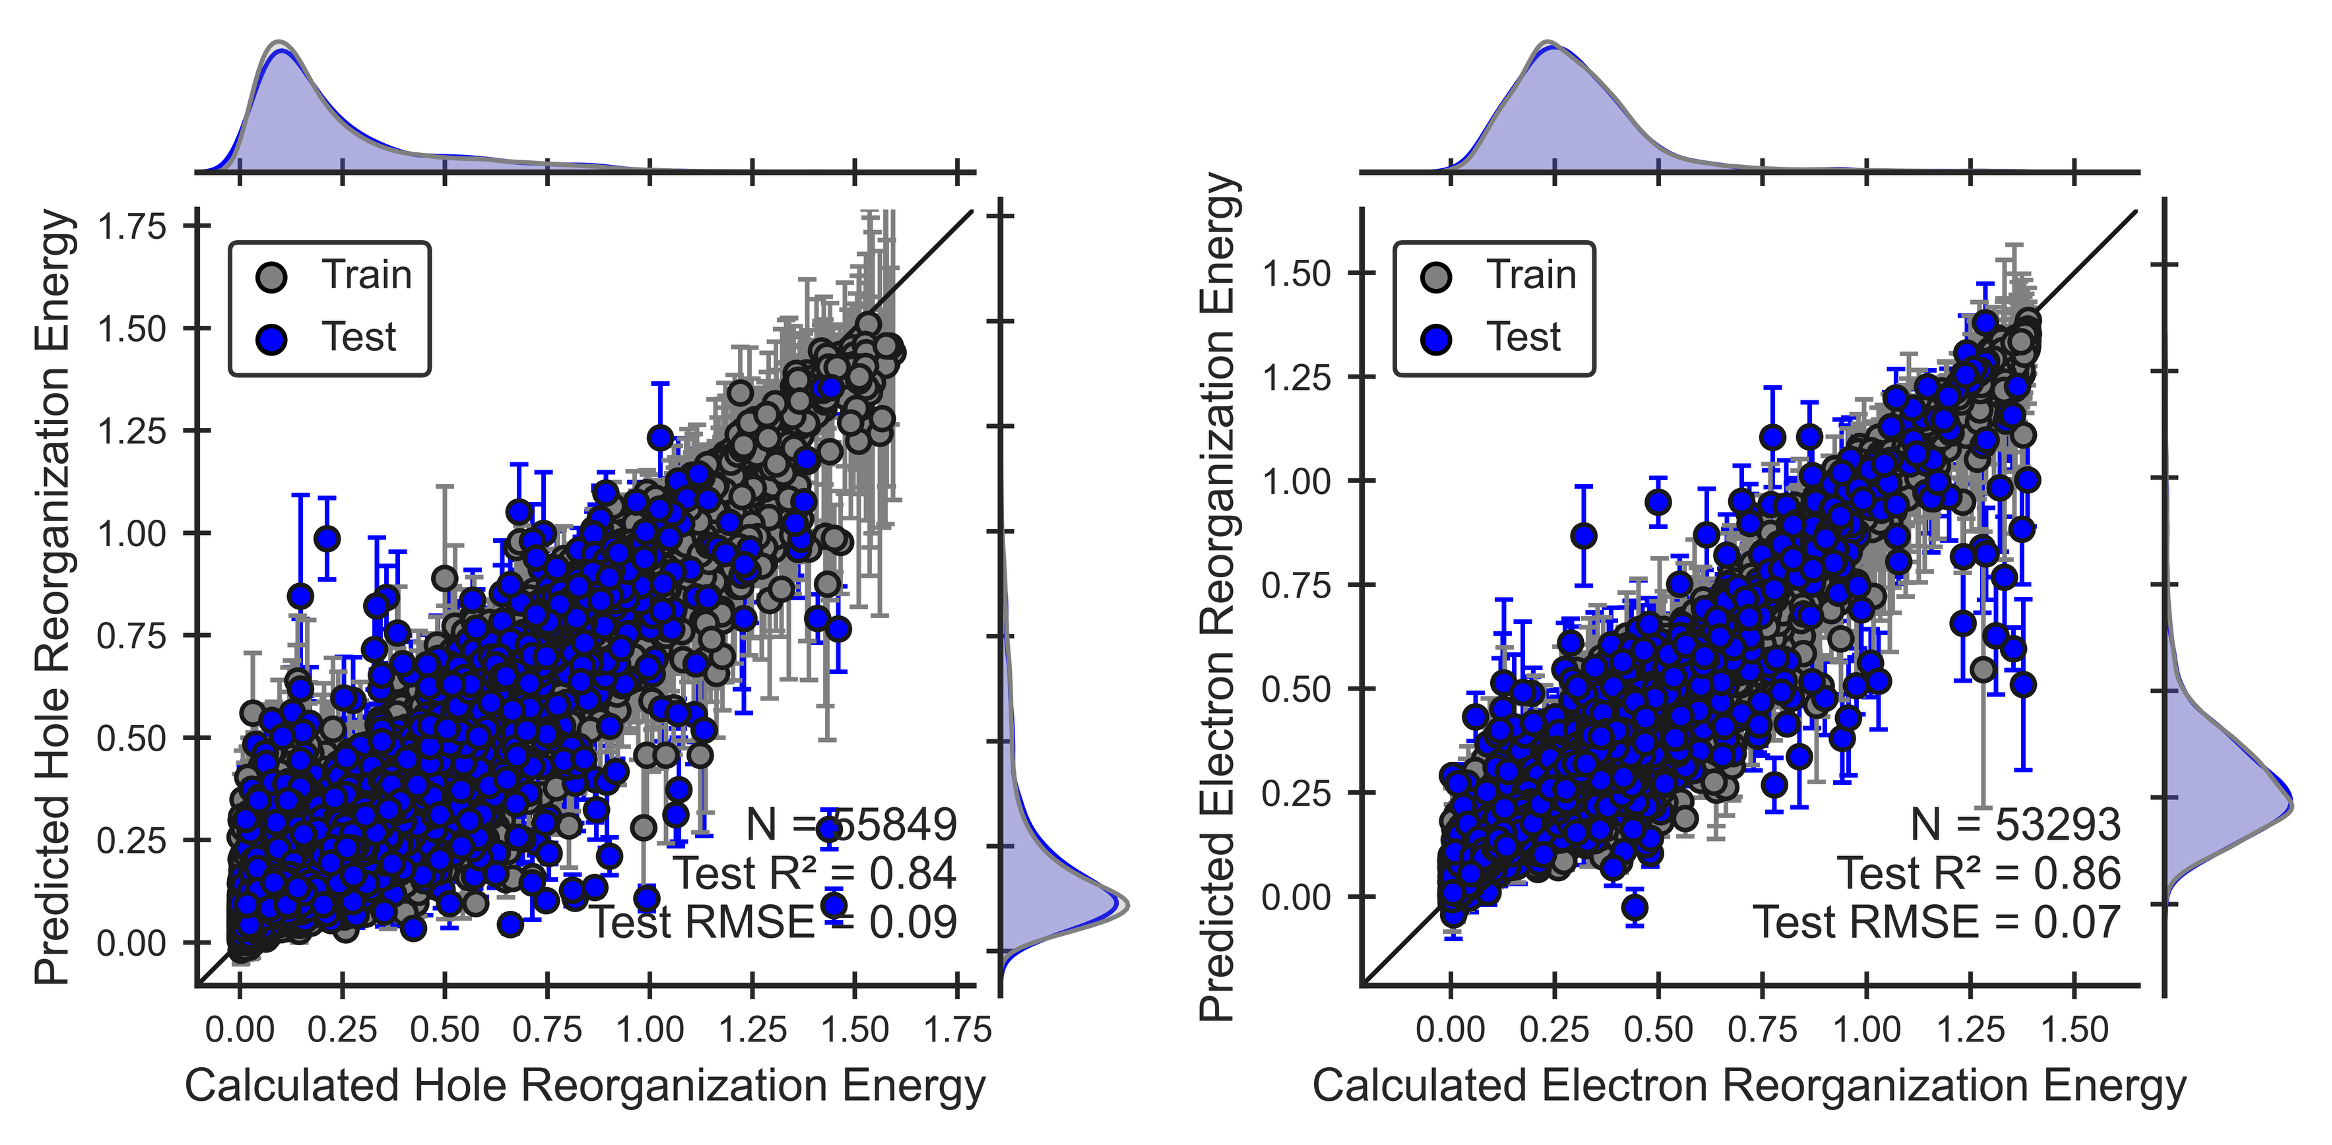
Figure 3. Performance of the hole and electron reorganization energy ML models for OLED molecules. Parity plots show that models can reproduce QM calculations (Eqns 6,7).
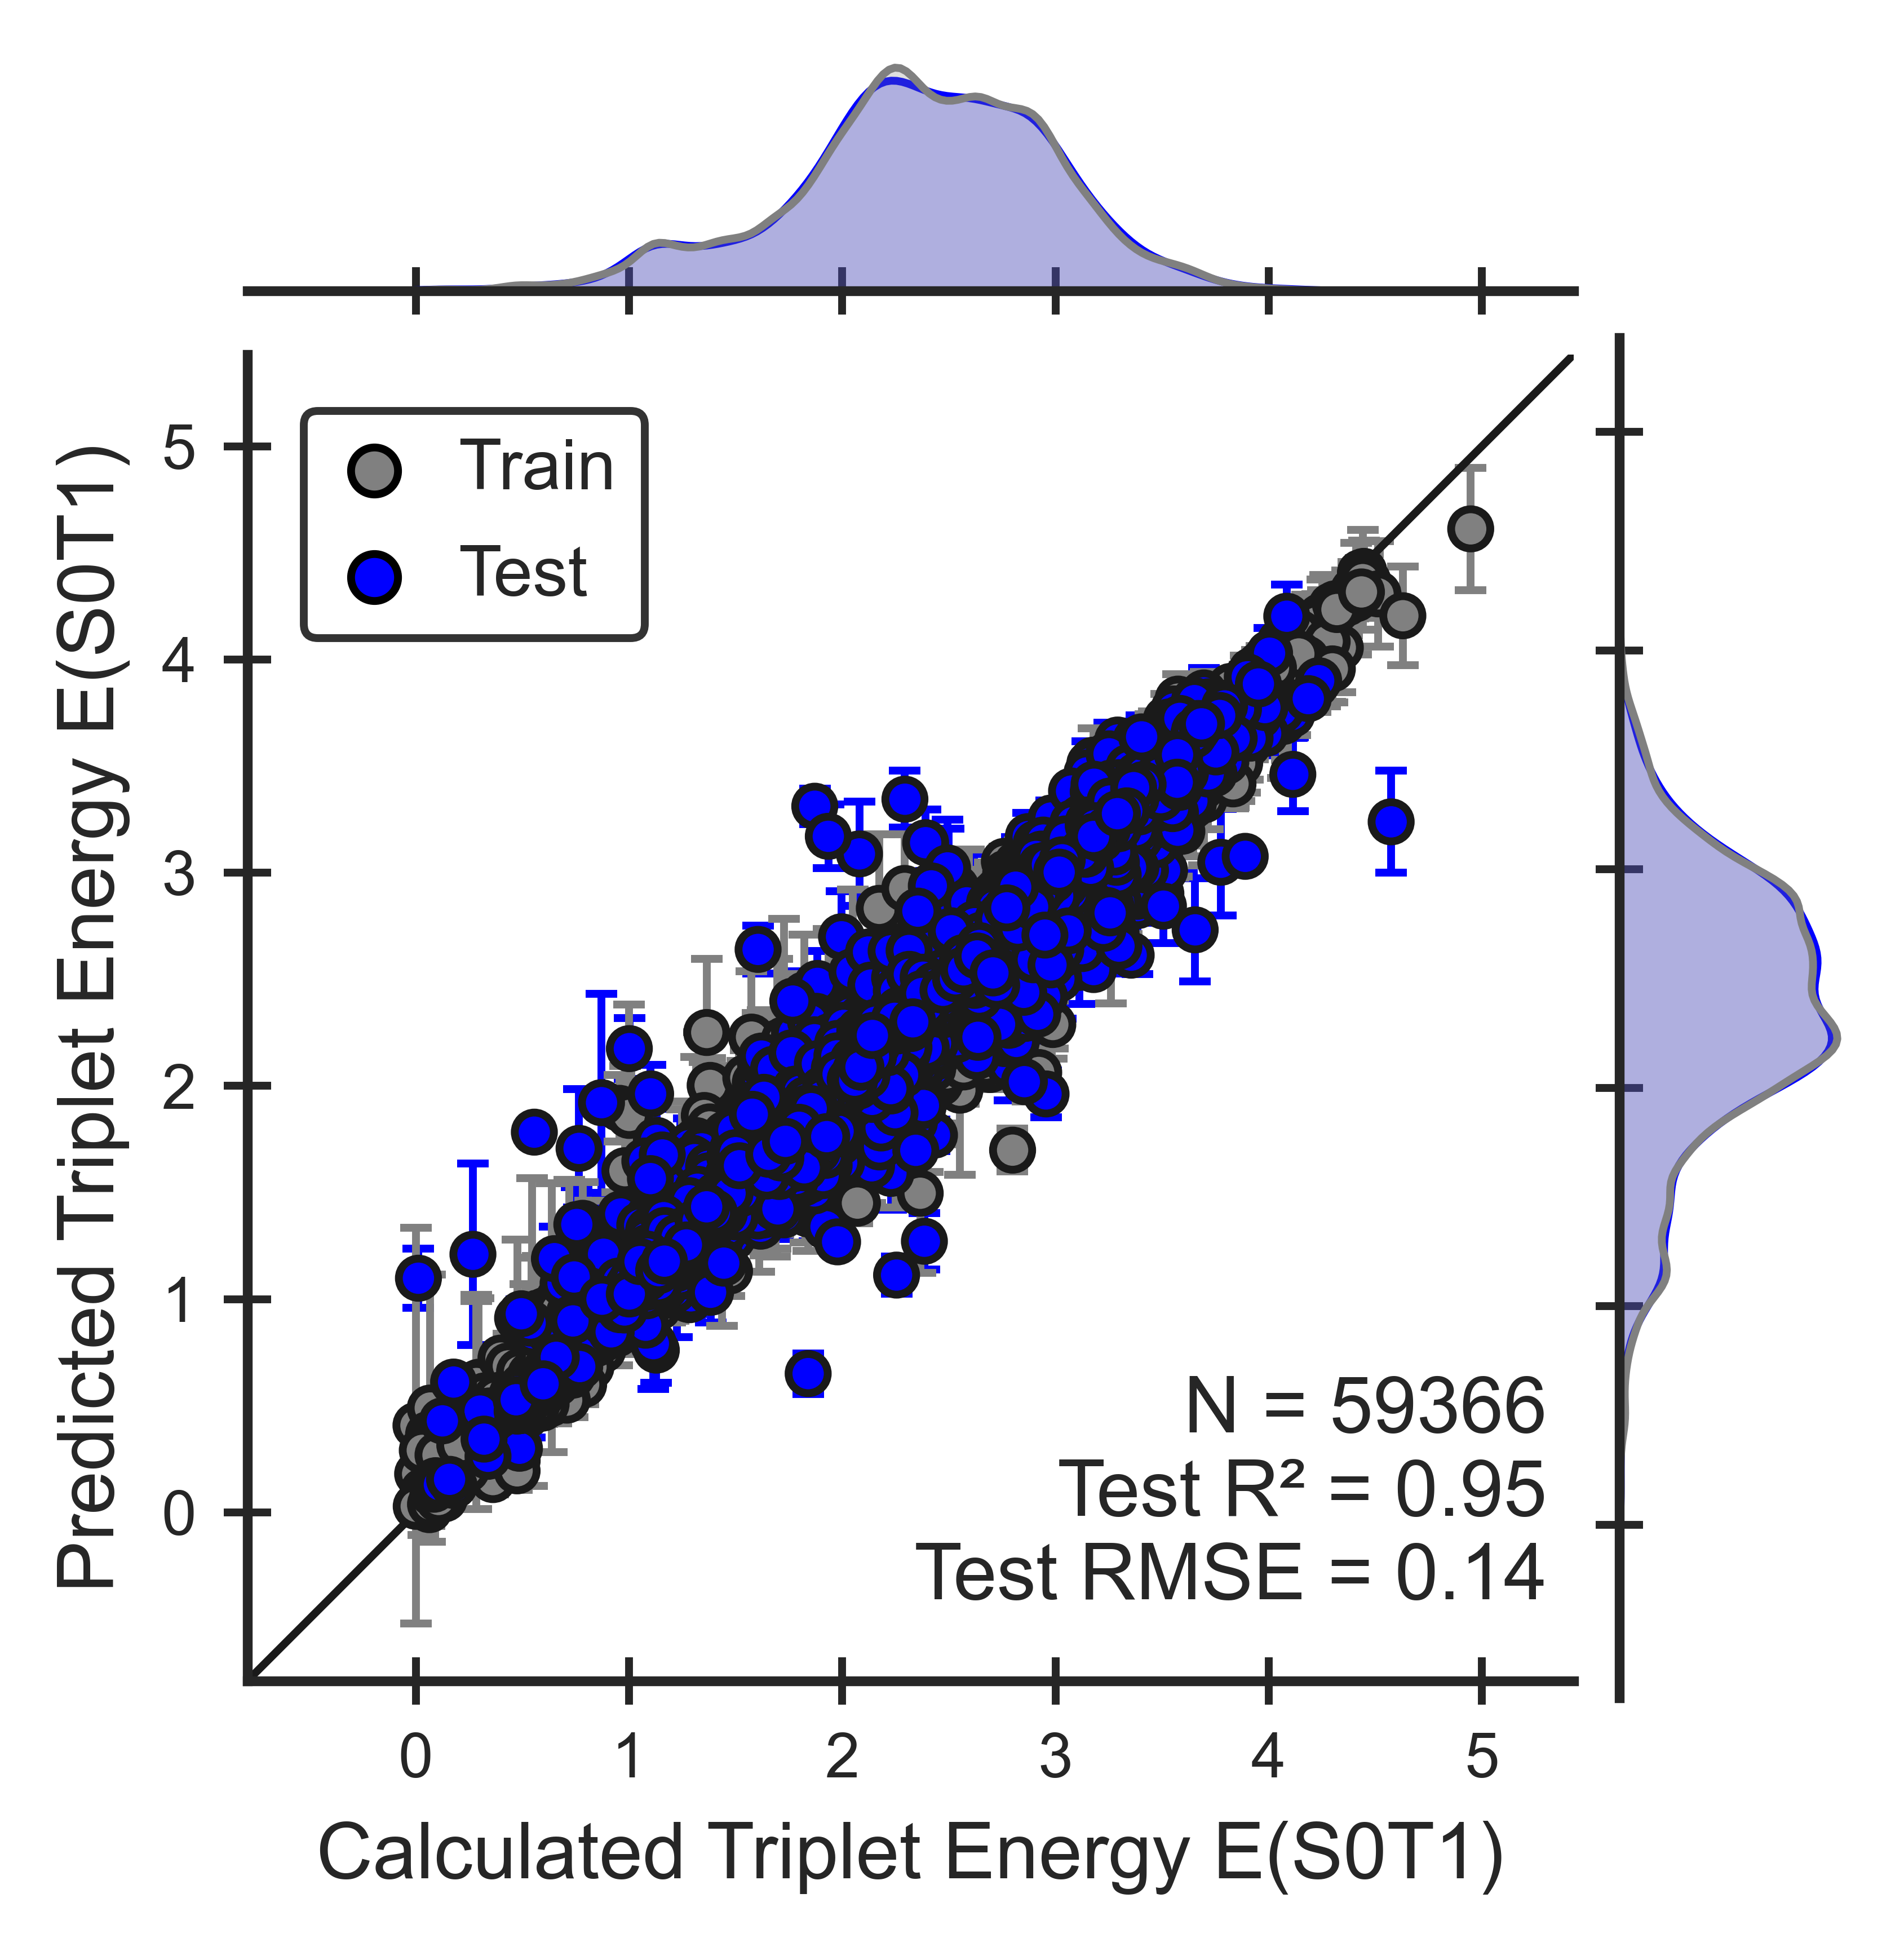
Figure 4. Performance of the triplet energy ML model for OLED molecules. Parity plots show that models can reproduce QM calculations (Eqn 8).
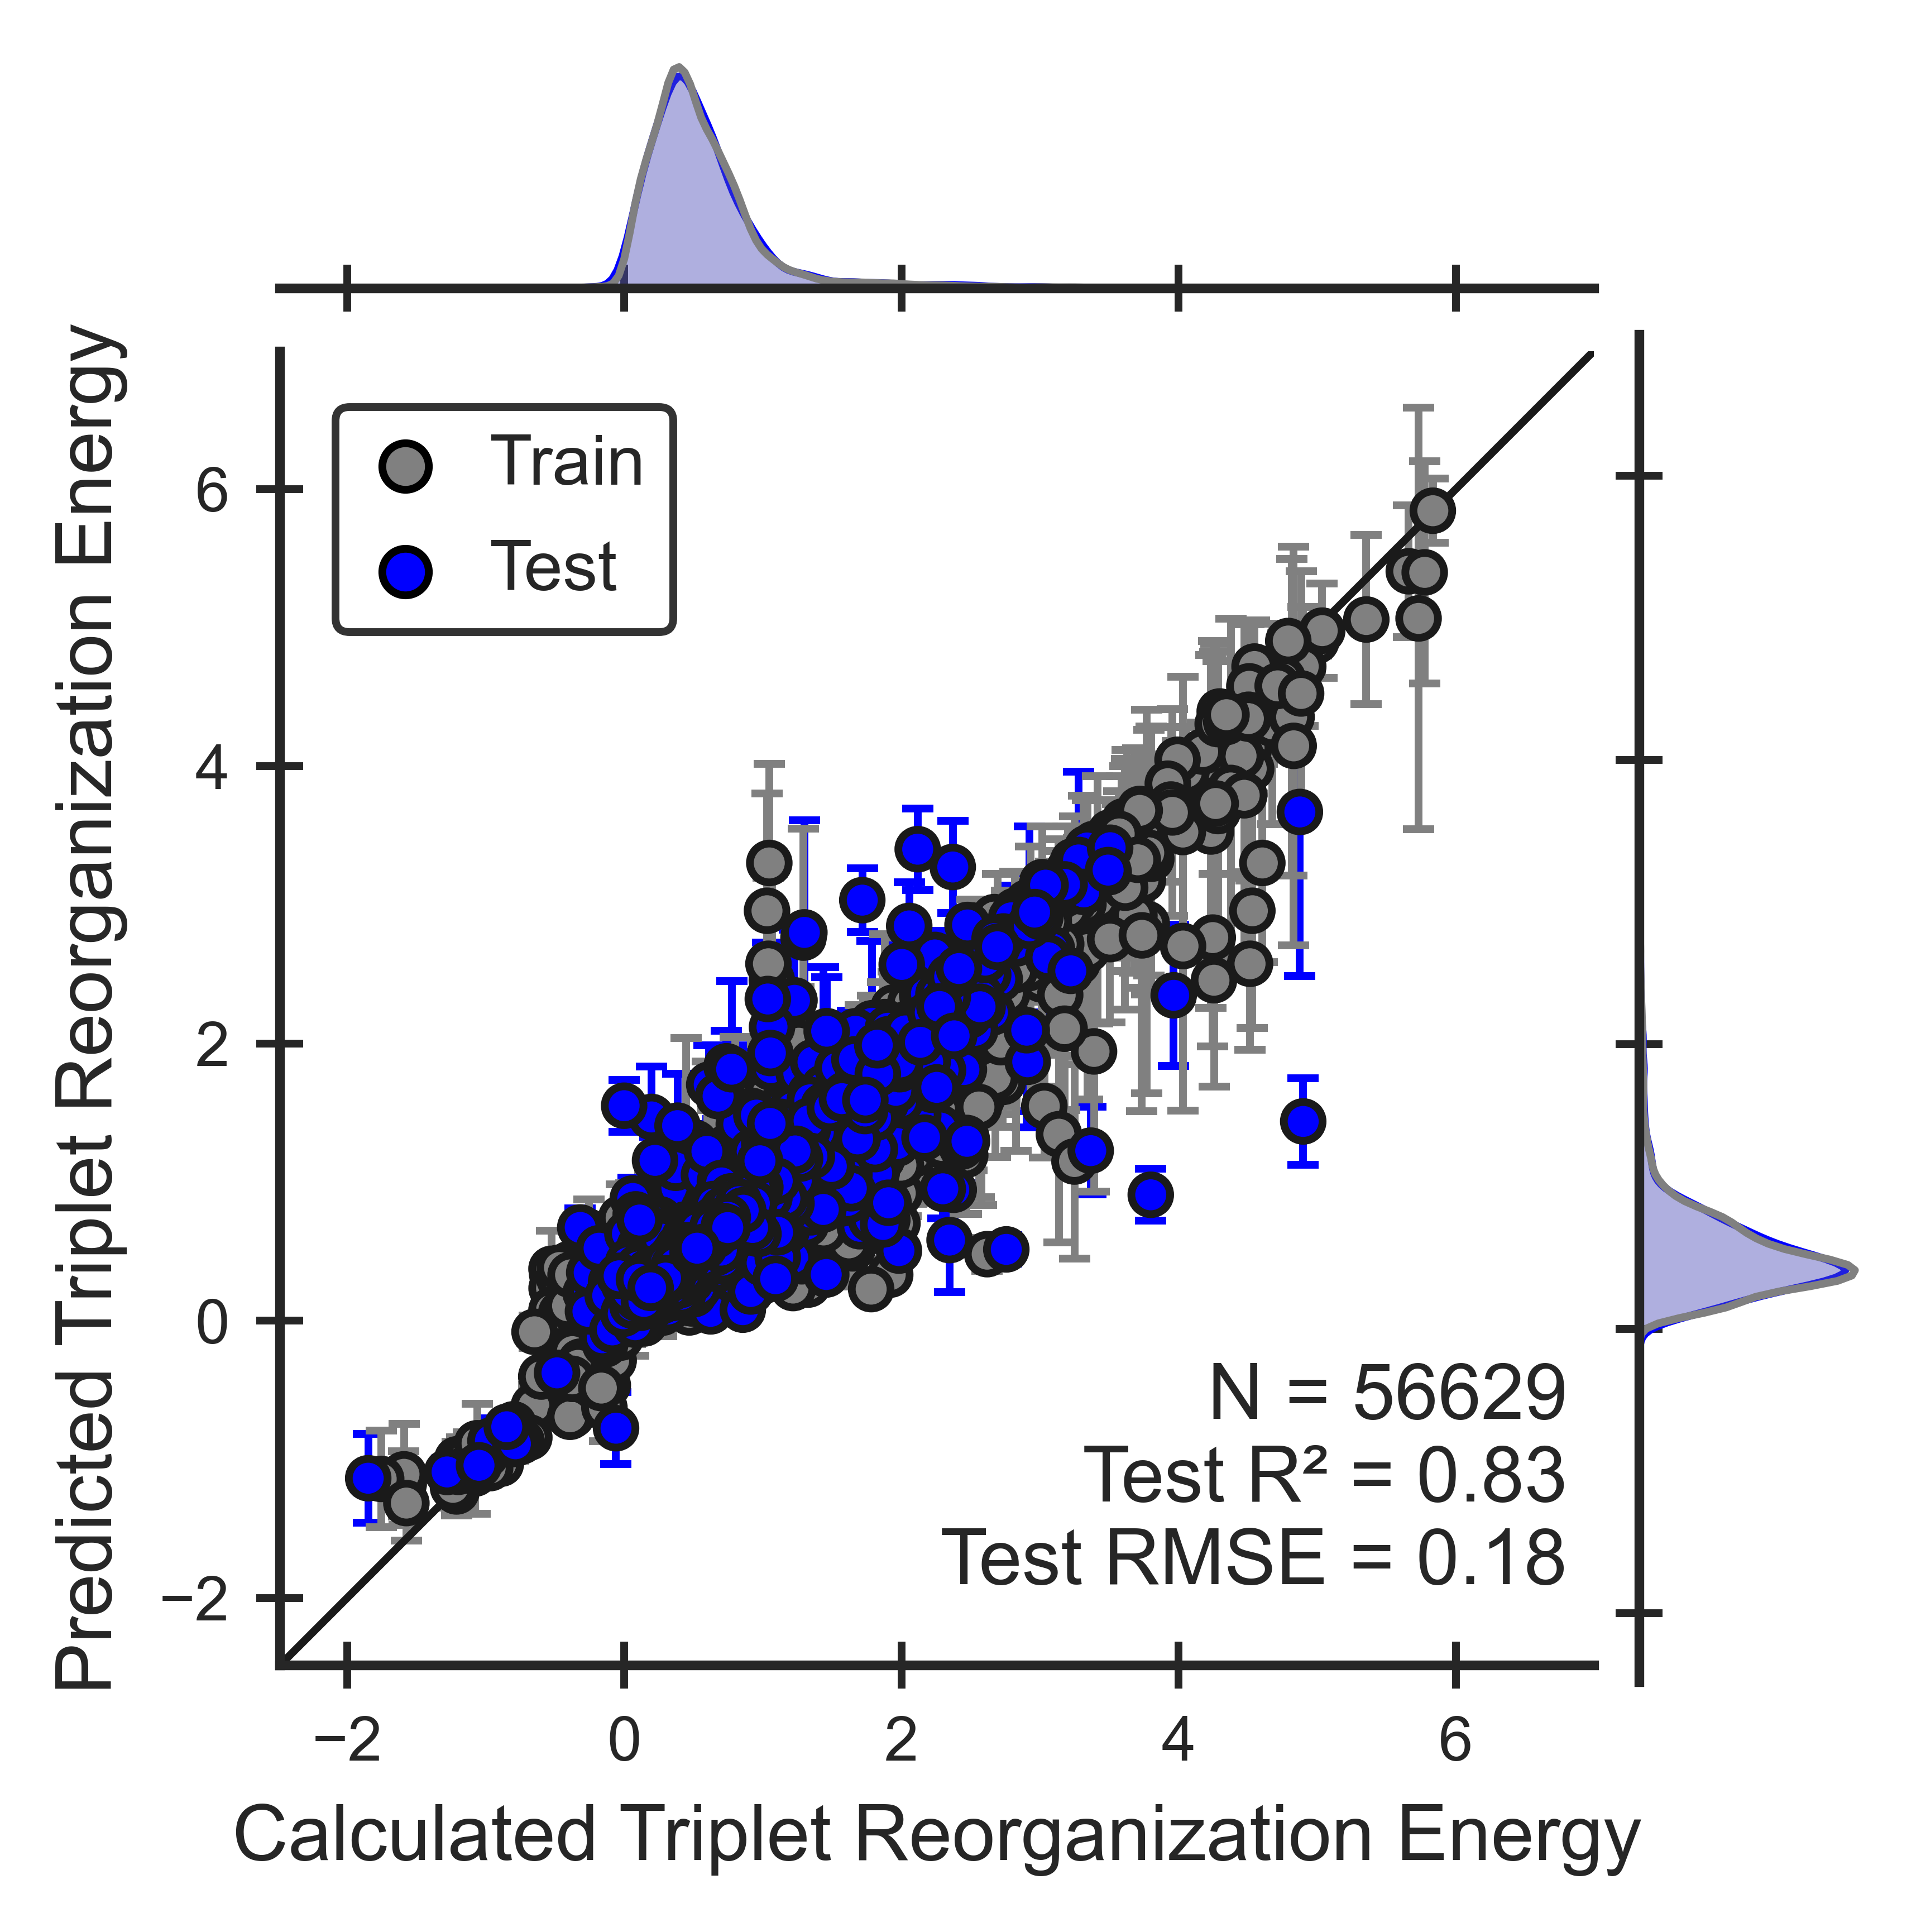
Figure 5. Performance of the triplet reorganization energy ML model for OLED molecules. Parity plots show that models can reproduce QM calculations (Eqn 9).
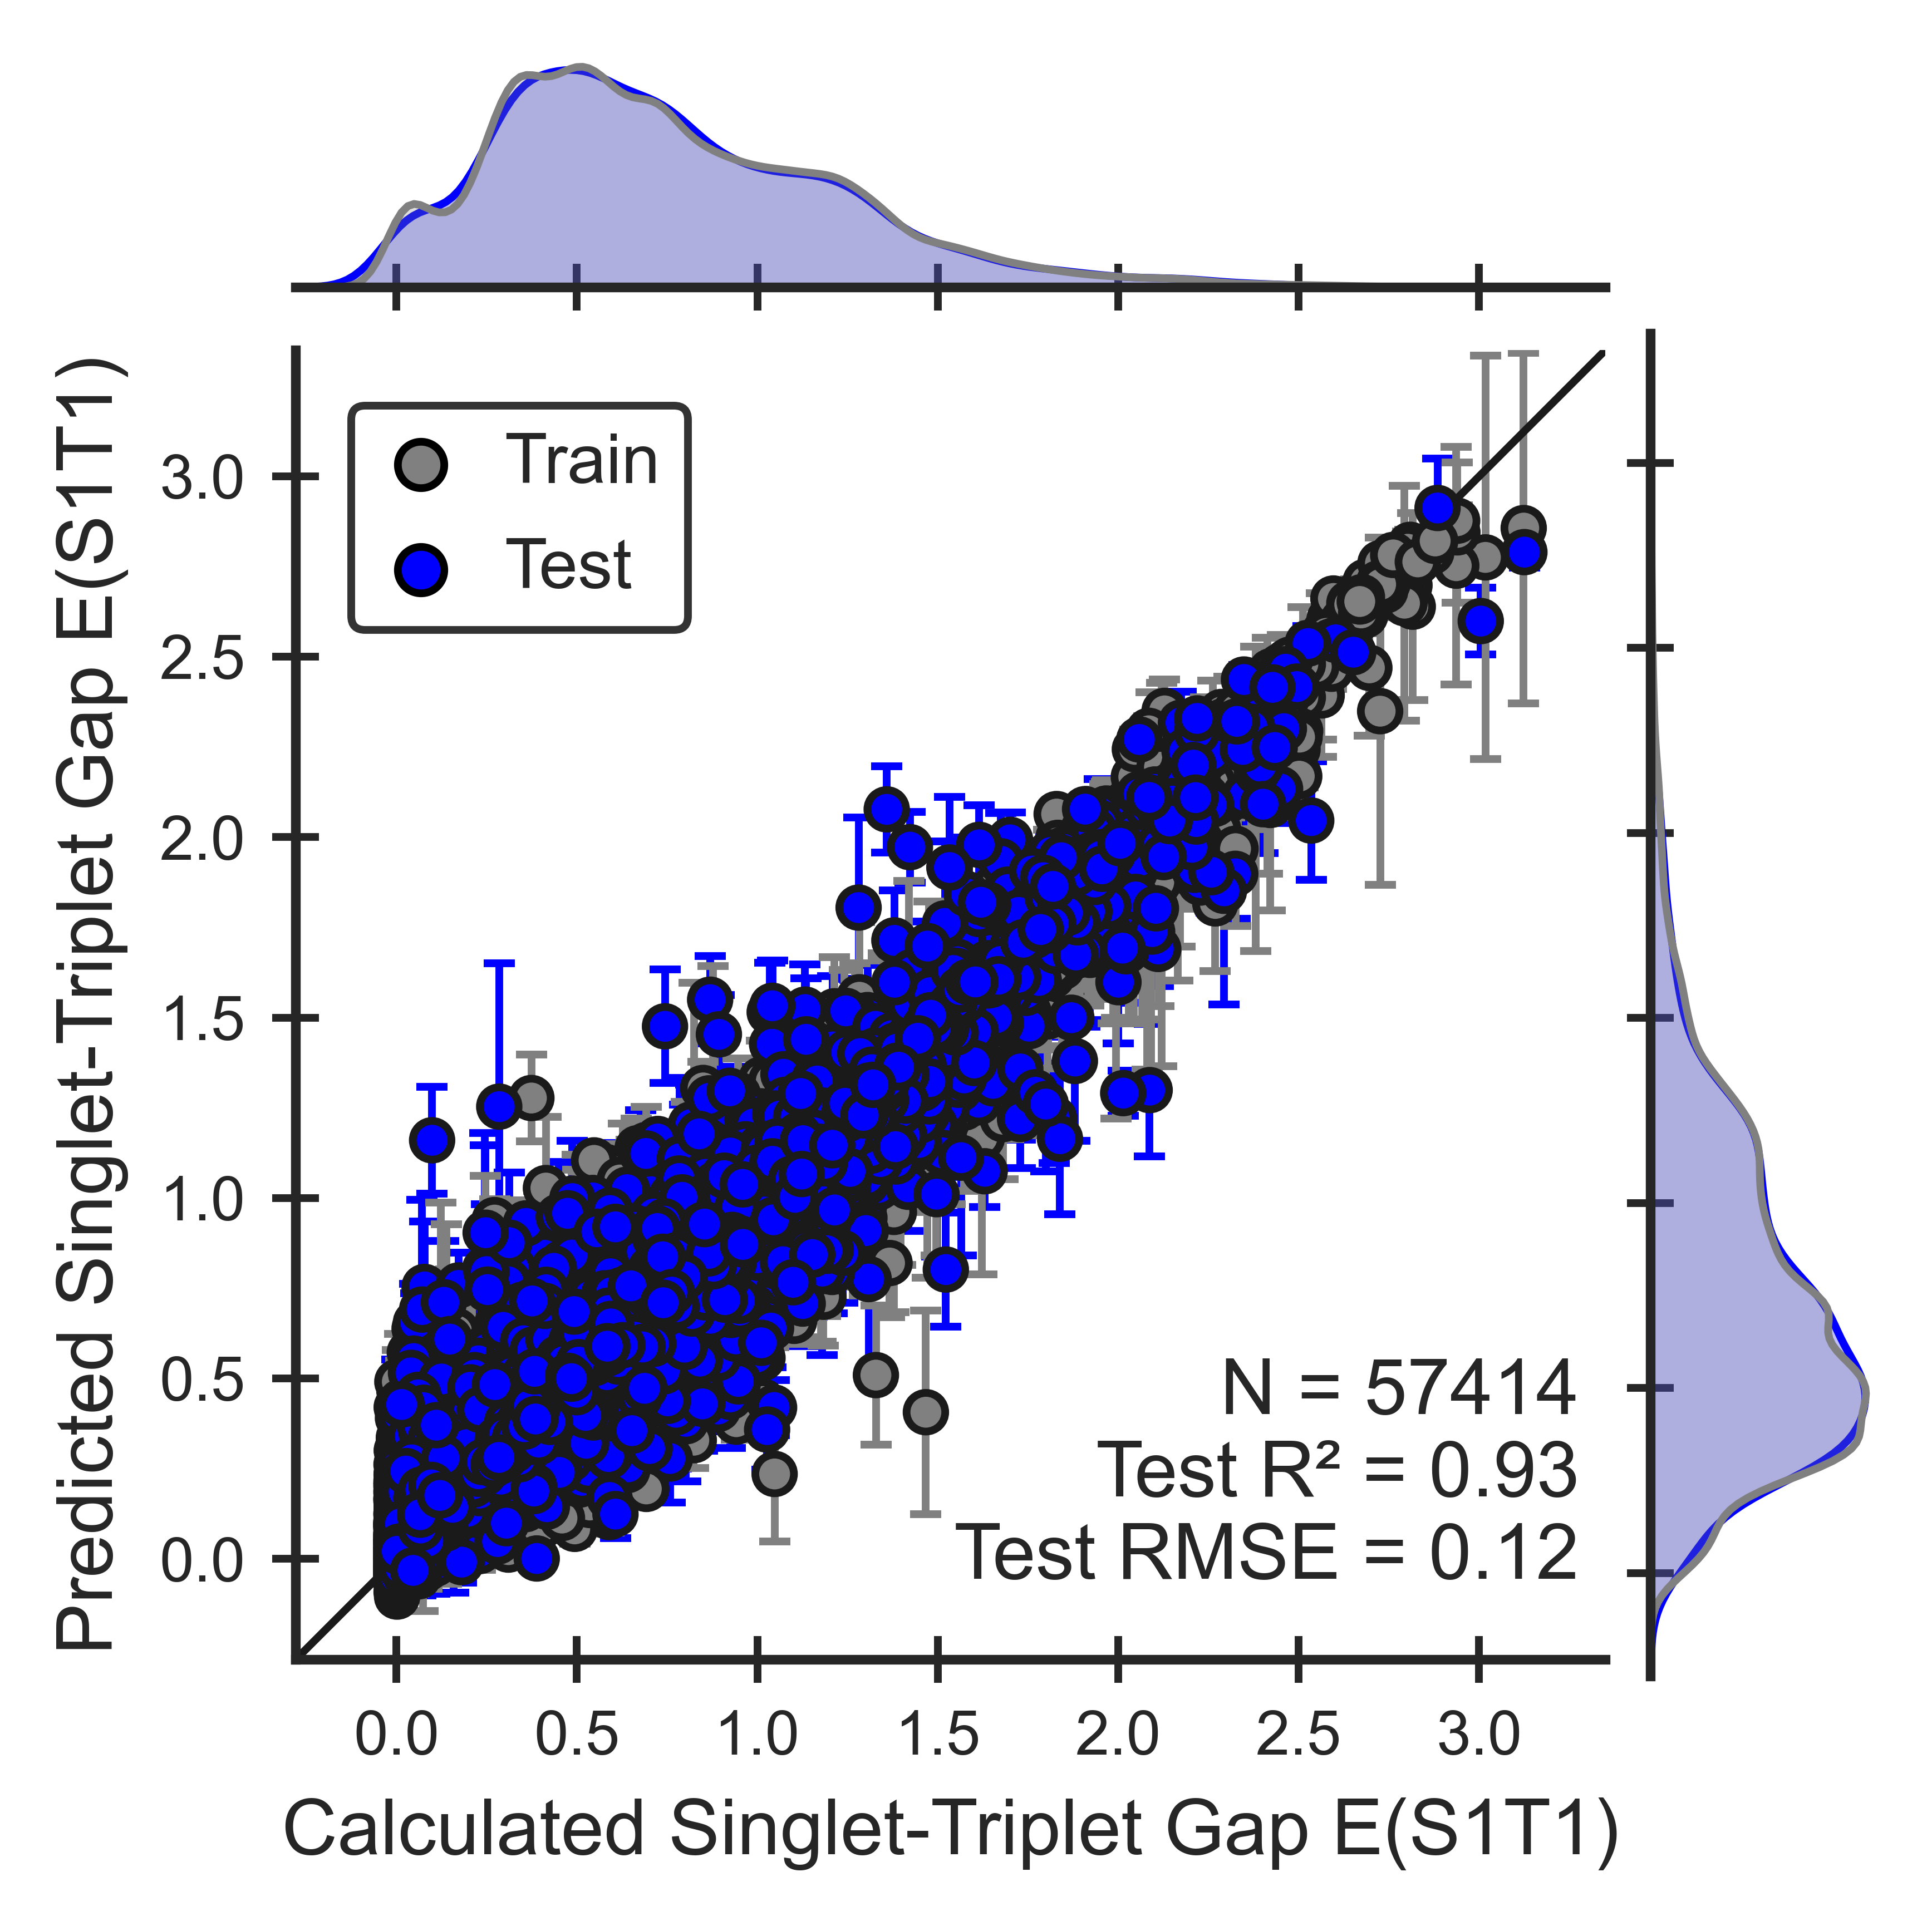
Figure 6. Performance of the S1T1 gap ML model for OLED molecules. Parity plots show that models can reproduce QM calculations.
References
- Roth, H.; Romero, N.; Nicewicz, D. Experimental and Calculated Electrochemical Potentials of Common Organic Molecules for Applications to Single-Electron Redox Chemistry. Synlett 2015, 27 (05), 714–723. DOI: 10.1055/s-0035-1561297.
- Fu, Y.; Liu, L.; Yu, H.-Z.; Wang, Y.-M.; Guo, Q.-X. Quantum-Chemical Predictions of Absolute Standard Redox Potentials of Diverse Organic Molecules and Free Radicals in Acetonitrile. J. Am. Chem. Soc. 2005, 127 (19), 7227–7234. DOI: 10.1021/ja0421856.
- Montalti, M., Murov, S. L.. Handbook of Photochemistry, 3rd Ed.; CRC/Taylor & Francis, 2006. ISBN: 9780367577902.
- Isse, A. A.; Gennaro, A. Absolute Potential of the Standard Hydrogen Electrode and the Problem of Interconversion of Potentials in Different Solvents. J. Phys. Chem. B 2010, 114 (23), 7894–7899. DOI: 10.1021/jp100402x.