Project Table Panel
The Project Table panel is used to display the contents of a project. It is also the primary interface for performing operations on selected project entries.
Each table row is associated with a project entry, which is a named collection of atoms that can have multiple molecules, but can generally be considered as a separate chemical structure. The table columns show properties of the entries.
To open this panel, in the main window choose Window → Project Table, press Ctrl+T (⌘T), or click the Show Project Table button on the Workspace Main Toolbar.

- Using
- Features
- Additional Resources
Using the Project Table Panel
The Project Table panel can be used for the following tasks:
-
Controlling what is displayed in the Workspace. Entries that are displayed in the Workspace are "included" entries. See Including Entries in the Workspace for information on including and excluding entries. You can also display the selected entries in sequence with The ePlayer.
-
Defining input for a program. Most computational programs accept the selected entries in the Project Table as input.
-
Examining, editing, and displaying properties. You can add, delete, and modify properties, you can use them to select entries, and you can plot them.
-
Organizing structures and their data. You can sort entries by property, rearrange entries, duplicate, delete, and merge entries. You can also create groups of entries and perform operations on the groups. The groups can be nested, to form a hierarchy of groups.
Because many operations work on selected entries, there is a range of tools in the Project Table panel for finding, sorting, and selecting entries.
Click on the section label below to learn more about that section:
Entries
The Project Table itself displays information on the entries in the project and their properties.
Rows: Each numbered row in the table contains information for one entry. Each unnumbered row in the table contains information for an entry group.
Columns: Each column in the table contains information for one property. Entries do not have to have values for each property displayed in the table; likewise properties do not have to have values defined for each entry. Some properties store the name of a file, which can be opened in the View File panel if it is a text file, by clicking in the cell and choosing View from the menu. Entries can be collected together into groups at any point in the table, and groups can be nested. Groups do not have property values for the group, only a title and a Maestro ID.
The table columns are partitioned between a fixed area and a scrolling area. The row number, inclusion state (In), and title are in the fixed area. You can move properties between the fixed and scrolling areas.
Likewise, there is a fixed area for table rows that contains a duplicate of chosen table rows, which can be used as shortcuts.
Shortcut rows: The shortcut rows allow you to quickly refer to a chosen set of entries. Double-clicking the row number of a shortcut row scrolls the table to the original entry, and selects just that entry. To add a row to the fixed area, right-click the row and choose Add to Shortcut Rows.
In Column: The In column contains a button for including or fixing the entry in the Workspace and excluding or unfixing it.
See Including Entries in the Workspace for more information. For entry groups, this column shows the number of entries in the group that are included in the Workspace.
The full contents of the table cell are displayed in a tooltip when the pointer is paused over the cell. Likewise, the full property name is displayed in a tooltip when the pointer is paused over the heading cell, along with the internal name. For properties that have units, the units are also displayed in the tooltip for the column heading.
Navigating the table
You can navigate the table in the usual way with the scroll bars, arrow keys, and page keys. You can also scroll the table vertically with the mouse wheel. In addition, there are some special keystrokes for navigating groups.
- Shift+UP ARROW (⇧UP ARROW) scrolls to the previous group, placing the group row at the top of the display. Likewise, Shift+DOWN ARROW (⇧DOWN ARROW) scrolls to the next group, placing the group row at the top of the display.
- Ctrl+UP ARROW (⌘UP ARROW) and Ctrl+DOWN ARROW (⌘DOWN ARROW) scroll in the same way as the SHIFT key combinations, but in addition, the group is expanded (if it is not already expanded) and all other groups are collapsed.
More information on using the keyboard in the Project Table is given in the topic Using the Keyboard in Maestro.
The entries are represented as a hierarchy of groups, in a tree-like structure. Each group can be expanded or collapsed by clicking the arrow icon in the Title column. For more ways of expanding or collapsing groups, you can use the Expand and Collapse items on the Table menu or the Group shortcut menu (which opens when you right-click on the group row). Examples are expanding groups that have entries selected in them, or expanding just one level of the hierarchy for a group.
Selecting entries
Selected entries are highlighted in blue. Selection of entries can be done manually as follows:
- To select a single entry, click in the Row column for the entry. All other entries are deselected.
- To select multiple contiguous entries, click the first entry, then shift-click the last entry.
- To select or deselect a single entry without affecting the selection of other entries, control-click the entry.
See Selecting Entries for more information on the ways of selecting entries.
Displaying structures
Entries that are displayed in the Workspace are called included entries. These entries are marked by a blue filled circle in the In column. Like selection, you can include a single entry in the Workspace by clicking in this column for the entry, you can include multiple contiguous entries by clicking this column for the first and shift-clicking for the last, and include or exclude an entry without affecting the inclusion of other entries by control-clicking in this column. You can also fix entries in the Workspace by double-clicking in the column. Fixed entries are not excluded from the Workspace when you include other entries. To unfix fixed entries, double-click the In column; to exclude them, use control-click. You can also use items on the Table menu. See also Including Entries in the Workspace.
For structures that contain a ligand-sized molecule, an image of the 2D structure of the molecule can be displayed in a column in the Project Table, by clicking the 2D Structure button on the Property toolbar

or choosing Table → Change Columns → Show 2D Structures. The column cells are blank for structures that do not contain a ligand-sized molecule.
Changing column widths:You can change the sizes of the columns in two ways. For individual columns, you can drag the border between two columns. The cursor changes to a double-headed arrow when you do so. You can also change the size of the columns to fit the width of the data in the columns, the heading width, or both, from the Columns button menu on the Property toolbar or the Table → Change Columns submenu. If you double-click on the right border of a column, it fits the column width to the width of the data.
Changing row heights: If 2D structures are shown, you can change the row height by dragging the border between rows. The 2D structure image changes size as you change the row height.
Choosing properties to display: You can select the properties that are displayed in the Project Table. To show or hide properties, use the Property Tree (Window → Property Tree). See Organizing Properties for more information.
Rearranging the rows and columns:To move the selected entries, drag them to the desired location , or choose Table → Move to → Other Row, or one of the other items on the submenu. The selected rows are placed after the last unselected entry that precedes the target location. To move entries to the beginning or the end of the table, drag them past the beginning or the end.
If you want to move entries into an entry group at a specific location in the group, make sure the group is expanded first. Otherwise, if you drag entries onto the group title row, the entries are placed at the end of the group.
If you want to move entire entry groups, you can select them and then drag the selection to a new location.
To move a column, drag the column header to the desired location, including to the fixed area, or use the Move To item on the shortcut menu to move the column. Columns that are moved to the fixed area are placed after the standard fixed columns. To rearrange the columns, choose Table → Change Columns → Reorder or Data → Edit Properties → Reorder and make the desired changes in the Reorder Properties Dialog Box.
Editing table data:To edit a table cell, click in the cell and make the changes. If the entry is not selected, it first becomes the selected entry. You must then click again in the cell to edit it. To finish editing, press ENTER or click somewhere outside the cell you are editing. To edit a property name, click in the header and make the changes , or choose Data → Edit Properties → Edit Name/Type and edit the name in the panel that is displayed.
Entry action buttons: The Title column contains some buttons as well as the title itself, for performing actions on auxiliary data associated with the entry.
For entry groups, the Title column contains a collapse/expand button at the left, to hide or show the contents of the group. The number of entries in the group is reported in parentheses after the title. Entry groups that contain hypotheses can also have a Workflow Action Menu button that opens a shortcut menu for performing actions on all the hypotheses in the group, and a WS button on Glide WS results groups that opens the Glide WS Visualizer Panel and sets it up for viewing Glide WS results.
For entries that have auxiliary data, buttons are present when the relevant data is available for actions on hypotheses (H), surfaces (S), trajectories (T), and vibrational frequencies (V). These buttons either perform an action or open a shortcut menu, from which you can choose from the various actions. The shortcut menu opens when you click or right-click the button.
If an entry has a trajectory (T) button, you should not edit the entry. If you do, a warning is displayed when you click the button, with the choice to reset to the original structure (discarding the edits) and open the Trajectory Player, or cancel the action. If you do want to modify the structure, you should create a new entry from it, and edit the new entry. You can remove the trajectory data from an entry by clicking on the T button and choosing Remove Trajectory Data. The T button for the entry and the trajectory data in the project are removed on confirmation (the trajectory itself is not removed: it is outside the project).
Entry groups that have been imported as a result of job incorporation may have a Workflow Action Menu (WAM) button  at the right of the row. The button opens a menu that has three kinds of items:
- Common tasks—These are listed at the top, if there are any, as separate items.
- Analysis—These items open panels that perform appropriate analysis tasks on the entries. They are usually displayed on a submenu.
- Next Steps—These items open panels that use the entries as input to another task.
The contents of each Workflow Action Menu are determined by the job that was run, and correspond to common or useful actions to take on the job results. The actions can be applied to one entry, several entries, or all of the entries in the group, depending on the chosen action. The items available on the menu may also depend on which entries are selected in the group. If an action operates only on a single entry, but there are several entries in the group to which that action applies, a submenu is shown so you can choose the entry (including the Workspace Entry if applicable).
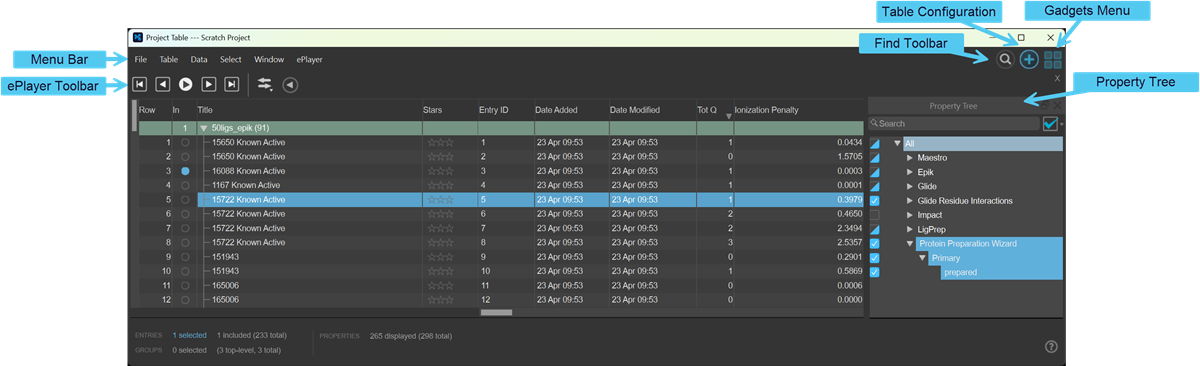
Project Table Panel Features
The Project Table panel contains the Project Table, a menu bar and a toolbar in the bar at the top, and a status bar below the table. It also has auxiliary toolbars that can be displayed for the task they support, and some panels that can be docked into the table area.
The Menu Bar
The menu bar has a set of menus that provide tools for managing entries, entry groups and properties, for importing and exporting data, and for displaying data. A brief description of the menus is given below.
- File—Perform actions on projects and structure files. This menu is the same as the File menu in the main window (see Menu Bar).
- Table—Perform actions on the rows and columns in the table, some of which operate on the selected rows (entries).
- Data—Perform actions related to the data (property values) in the table. See Entry Properties for more information.
- Select—Select entries (rows) in the table. See Selecting Entries for more information.
- Window—Show or hide windows and tools related to the panel.
- ePlayer—Play through selected structures in the Workspace. See The ePlayer for more information.
The Toolbars
The toolbars provide more direct access to many of the features that are on the menu bars. The general features and behavior of the toolbars are described in Project Table Toolbars. Links to the topics that describe these toolbars are given below.
The Status Bar
The status bar, located at the bottom of the panel, displays information on the number of entries, groups, and properties. By default the following values are displayed.
- Entries: total number, number selected, and number included..
- Groups: total number and number selected.
- Properties: total number, number displayed.
More information is displayed when performing operations on the table:
- Filtering: number of entries displayed, entry search string
- Find/replace: Number of matches to text search string.
Shortcut Menus
The Project Table panel has shortcut menus, which are displayed when you right-click in the table. There are four general shortcut menus: for entries, properties, entry groups, and single entry groups. In addition, there are shortcut menus for surfaces (right-click on the S in the Title column), for Phase hypotheses (right-click on the H in the Title column), and for trajectories (right-click on the T in the Title column). See Project Table — Shortcut Menus for more information.