Key Concepts and Features of Maestro
Maestro is Schrödinger’s interface for Small Molecule Drug Discovery.
Maestro is Schrödinger’s streamlined portal for access to state-of-the-art predictive computational modeling and machine learning workflows for molecular discovery. With an intuitive, advanced graphical user interface, Maestro provides users of all experience levels a unified entry point for gaining novel molecular insights to drive their research.
The following are some of the most important concepts and features for
Click on the section label below to learn more about that section:
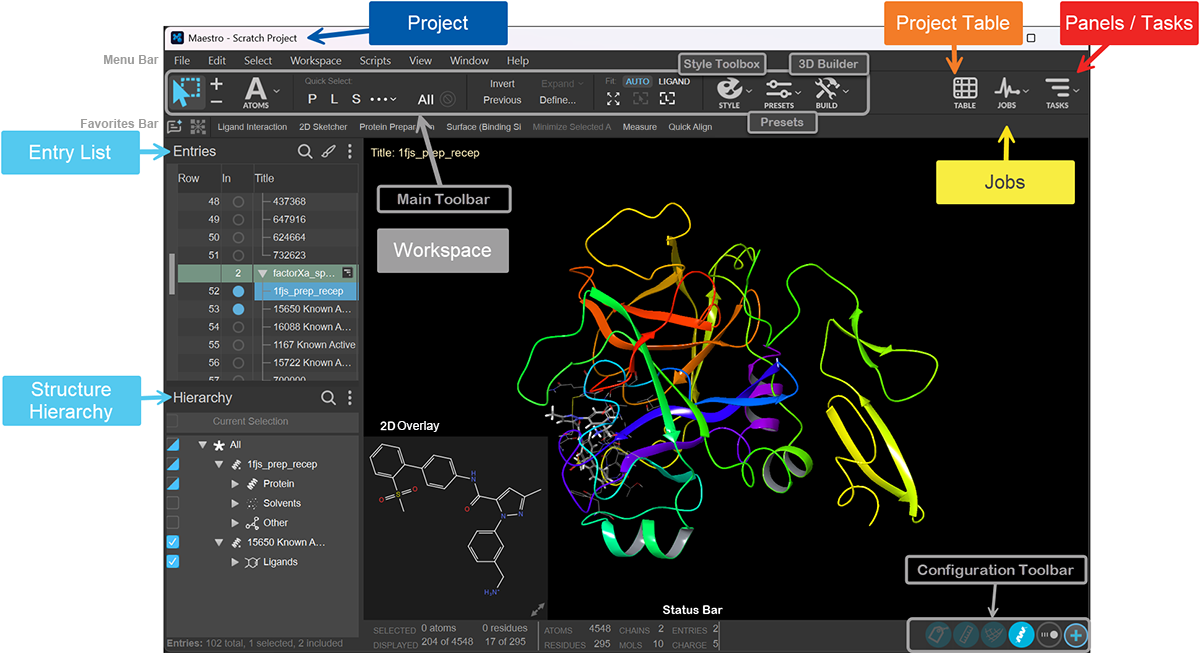
Maestro Projects
Maestro organizes all work into a project (.prj extension). The project is a collection of structures and data in Maestro. If there is no named project open, Maestro creates a scratch project to work from. Scratch projects are temporary, so we recommend saving the project.
Entry List (Entries) and Structure Hierarchy (Hierarchy)
Entries are imported or created structures and their associated data. The entry stores a collection of atoms; molecules (structures) grouped together and assigned an entry ID and a title. File types that can be imported include .pdb, .sdf, .smi as well as .mae files (native Maestro file type) among with many others (see a complete list of supported file types in the Import Dialog Box documentation).
The Entry List displays all the entries in the project, letting you choose which ones to view in the Workspace.
Workspace
The Workspace is the central area in the Maestro window. It is used for visualizing the entry structures in 3D, applying styles, and modifying the structures.
The Main Toolbar has a collection of selection, viewing, and styling tools. The selection tools make it easy to choose common objects and create more complex selections in the Workspace.
You can style each set of selected atoms with the Style Toolbox, or, style the entire Workspace quickly using the Preset Styles.
You can build and edit structures using the 3D Builder, which allows you to delete selected atoms and bonds, add fragments to them, or modify their properties.
The Workspace Configuration Toolbar has toggles for showing or hiding commonly used objects in the Workspace: ribbons, interactions, clipping planes. Some toggles include a  button to open respective menus.
The 2D Overlay shows the 2D structure of any ligands detected in the Workspace.
The Status Bar shows information on the contents of the Workspace and individual atoms.
Project Table
The Project Table button opens the Project Table which contains all project entries and their properties. Use the Project Table and its menus to select specific sets of entries, import, generate, view and modify data, and create charts.
Jobs
Jobs are scientific computations set up and submitted via the panels that run on local and remote resources. The Jobs button shows the status of jobs started from the project, and gives access to the Monitor Panel to view running or recently completed jobs.
Tasks
Use the Tasks tool to open application panels and perform tasks. Tasks are organized by topics, methodologies, and application. Or, use the search field to find panels by name or function.
Other Important Features
Many but not all of the following features can be found on the image above. Click the links (where available) for more information.
- Menu Bar—contains menus for various actions including the Window menu that can show important Workspace components such as the Find toolbar, the Clipping Planes window, and the Command Input Area among others.
- Favorites Bar—buttons for tasks designated as favorites in the Task Tool. You can add items by clicking the pale star next to any action in the Task Tool, and remove items by right-clicking and choosing Delete.
- Fitting Buttons—tools for zooming the view to specific content.
- Clipping Planes—options to adjust the clipping.
- Sequence Viewer—shows the sequences of the proteins and nucleic acids in the Workspace.
- Command Input Area—text box for typing in Maestro commands.
- LiveDesign Connection—the connection status to a LiveDesign server is indicated by the color of the icon: a green icon indicates that you are currently connected to a LiveDesign server, while a gray icon indicates you are disconnected. Click to open the Connect to LiveDesign Dialog Box